

Table Of Content


Every day, millions of people scroll through their feeds, watch stories, and double-tap on content that catches their eye. For businesses, that means there’s a huge chance to connect with the right audience if you know what works.
That’s why we’ve pulled together over 200 Instagram marketing statistics. They cover everything from how often people engage with posts to what kinds of content get the most attention.
If you’re planning your next campaign or just looking to improve your posts, these numbers will help you see what’s happening on Instagram right now and how you can make the most of it.
Update (June 2026): We refreshed this article for 2026, corrected the data, and added new platform developments, key takeaways, and an FAQ.

Instagram User Demographics
Instagram has 2 billion monthly active users worldwide in 2026.
51% of global Instagram users identify as female, while 49% identify as male.
The largest age group on Instagram is 18–24 years old, making up 32% of the user base.
Users aged 25–34 account for 29% of total active accounts.
Around 14% of Instagram’s audience is aged 35–44, showing steady engagement from older millennials.
8% of users are between 45–54 years old, while 4% are aged 55–64.
Instagram penetration in the United States has reached 67% of the total population.
In India, Instagram has over 350 million active monthly users, the largest national audience.
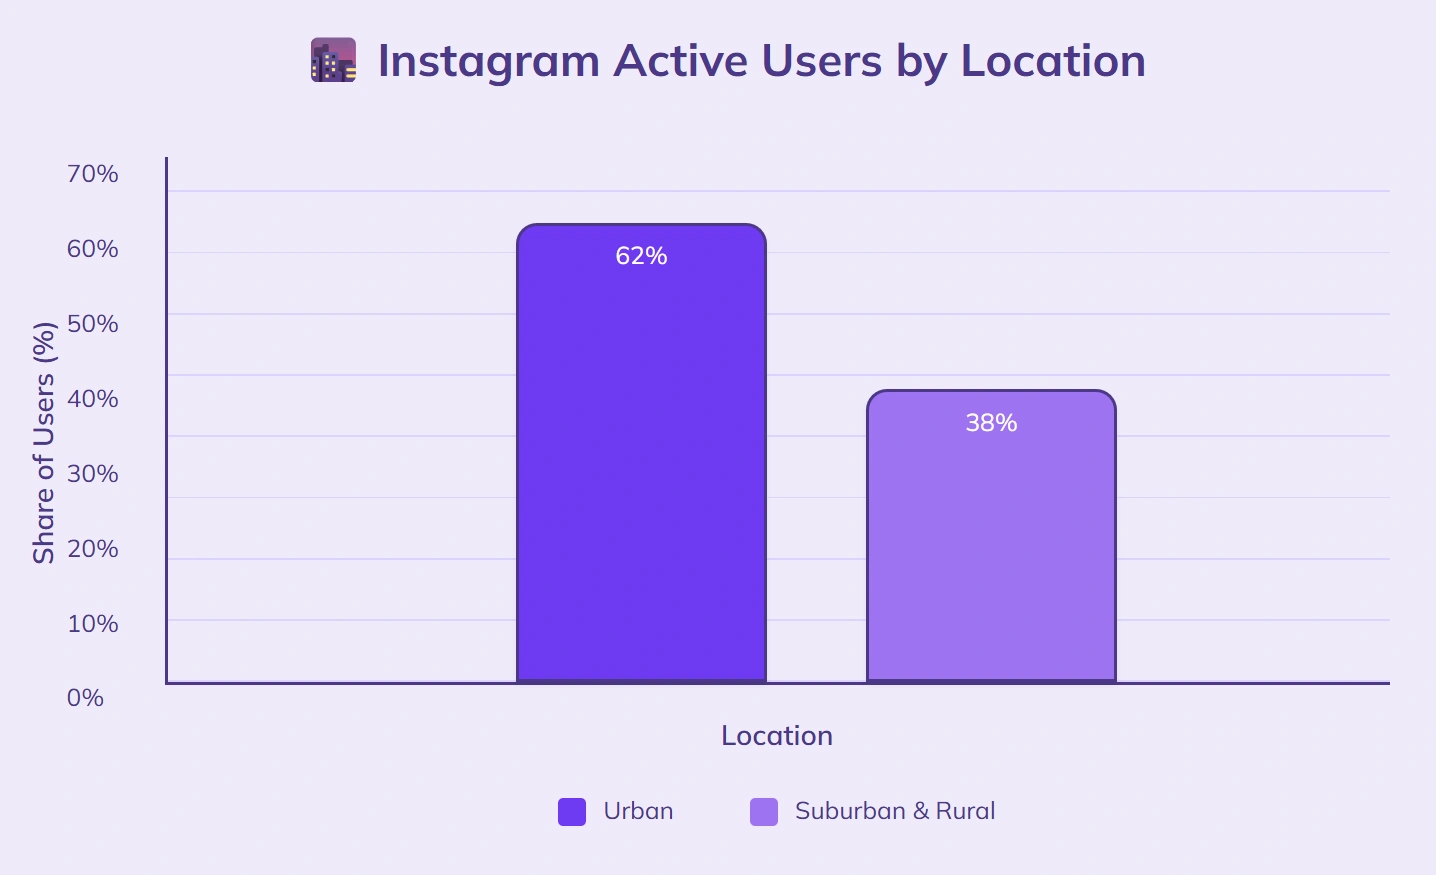
Urban residents make up 62% of Instagram’s active users, compared to 38% from suburban and rural areas combined.
Roughly 72% of Instagram users access the platform daily, with the average daily usage at 33 minutes.
AI-Powered Video & Content Creation for Instagram Marketing
65% of Instagram marketers say AI text-to-video tools helped them publish Reels faster and more consistently.
Brands using AI avatars in Instagram Stories report a 34% increase in engagement compared to static images.
41% of Instagram ad campaigns that used AI voiceovers saw higher completion rates than those with stock voiceovers.
72% of social media teams using automated editing tools say they post Instagram Reels at least 3x more frequently.
57% of Instagram creators repurpose Shorts into Reels using AI video generators, saving an average of 5 hours weekly.
Videos with AI-generated captions on Instagram see 23% higher watch time compared to those without subtitles.
Brands using AI reel generators report a 38% increase in follower growth within the first 90 days.
48% of creators use AI YouTube video generators to cross-post clips on Instagram, resulting in 27% higher impressions.
Instagram Usage Behavior
72% of Instagram users open the app at least once per day.
The average user spends 33 minutes per day on Instagram.
45% of daily active users check Instagram multiple times throughout the day.
68% of users watch Instagram Stories daily.
Reels are viewed by 54% of all active users each week.
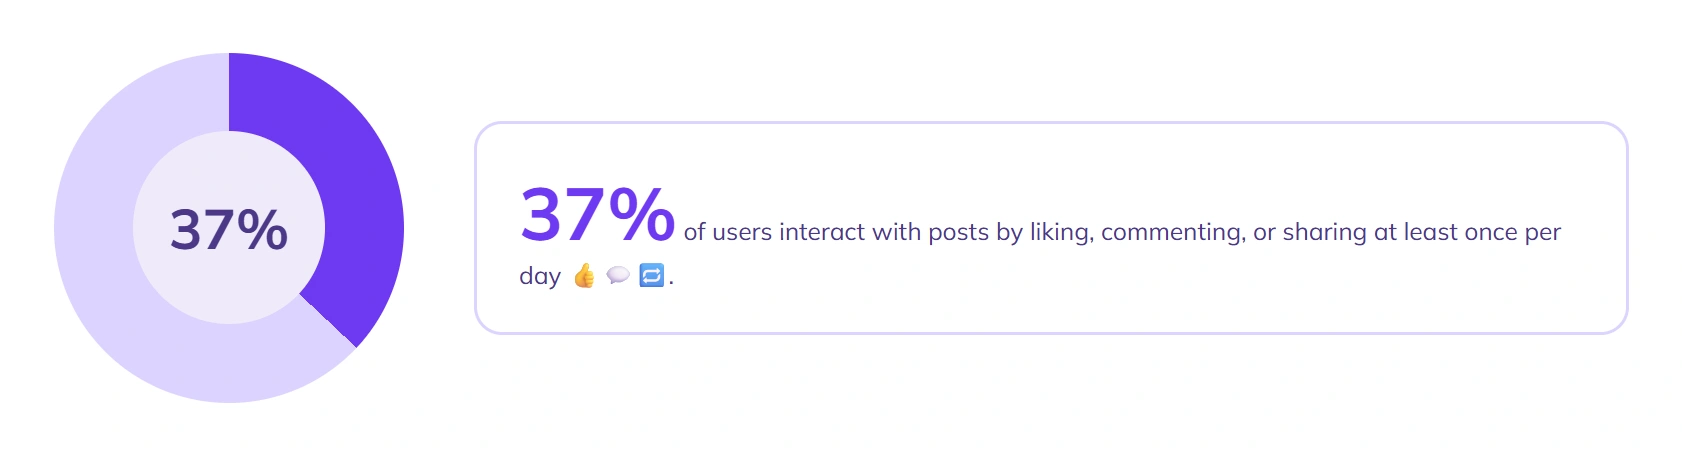
37% of users say they interact with posts by liking, commenting, or sharing at least once per day.
Direct Messages account for 23% of total user activity on Instagram.
41% of users follow at least one brand account.
Around 32% of users have purchased a product directly through Instagram in the past month.
29% of users save posts to revisit later at least once per week.
Instagram Growth Trends
Instagram added 88 million new active users globally between 2024 and 2025.
The platform’s global user base grew by 6.3% in the past 12 months.
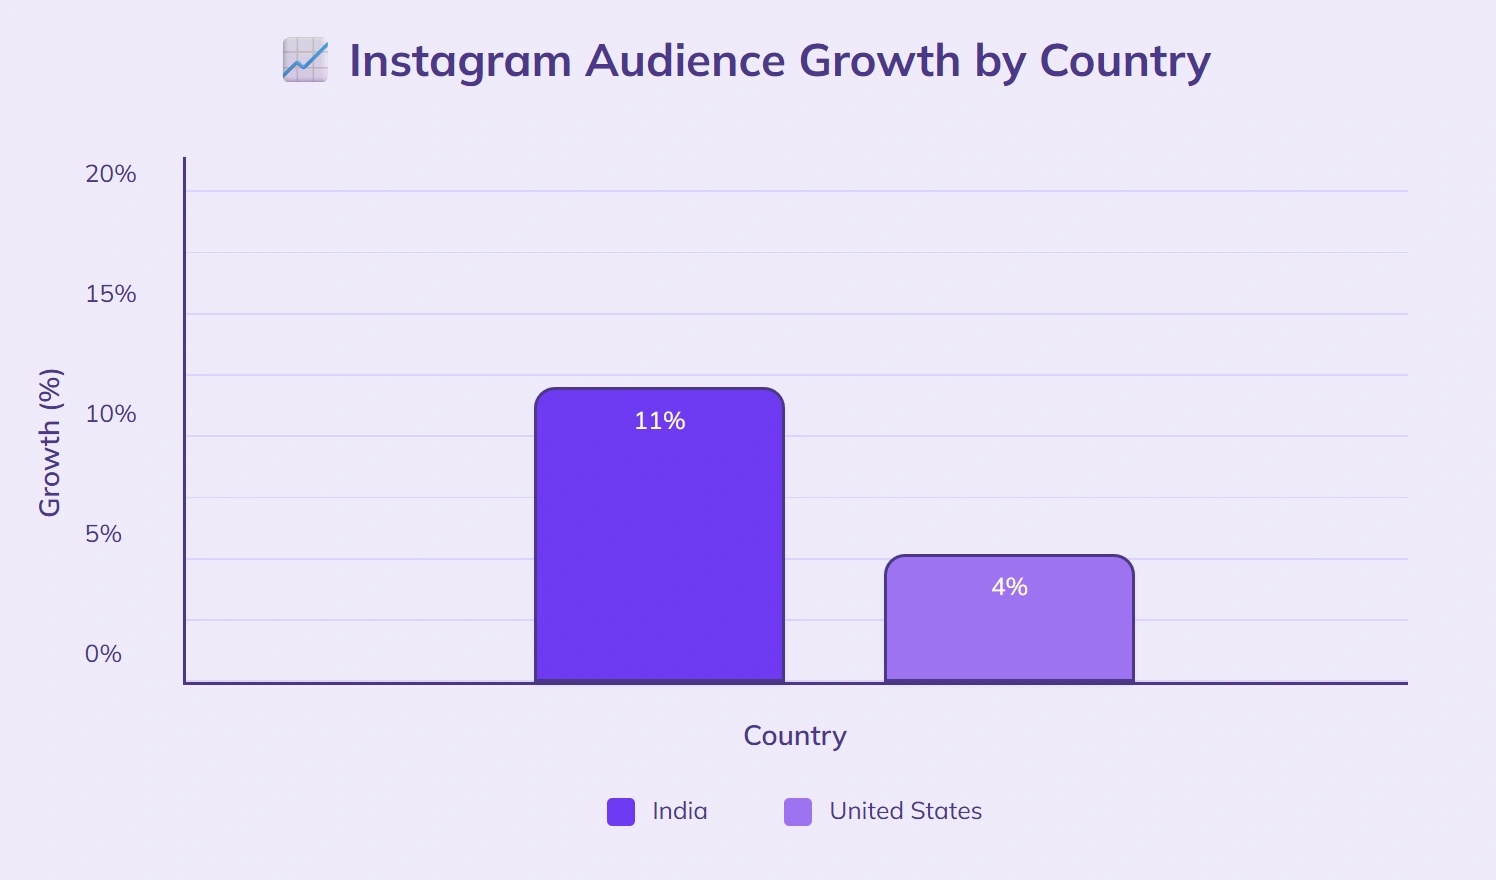
India’s Instagram audience grew by 11%, compared to 4% growth in the United States.
Daily active users increased by 5.1% year over year.
Reels usage grew by 19%, while Stories usage increased by 7% over the same period.
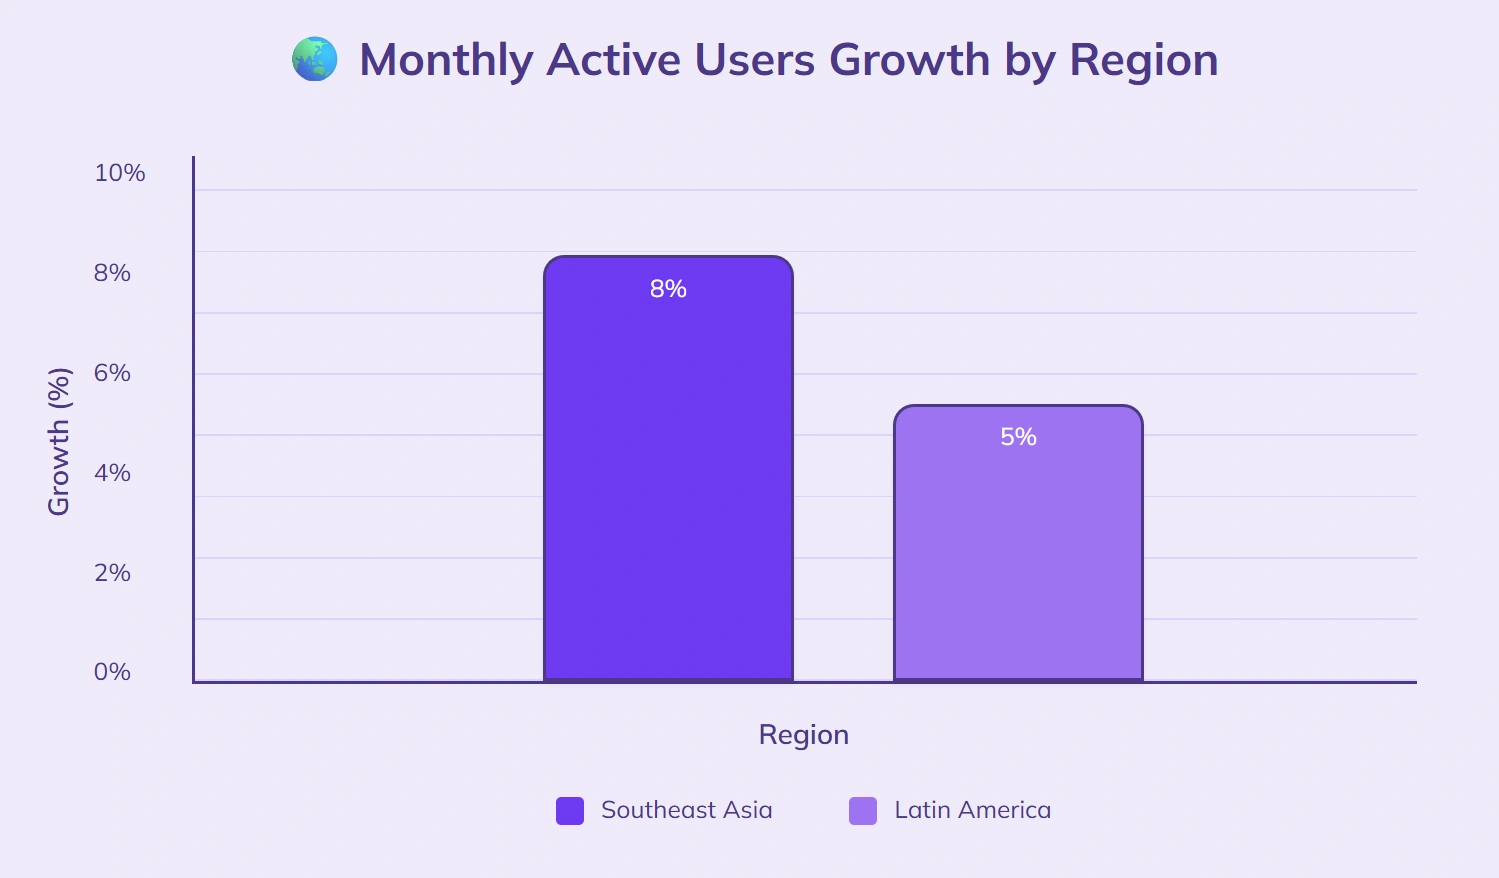
Monthly active users in Southeast Asia grew by 8%, outpacing Latin America’s 5% growth rate.
54% of Instagram users in 2025 joined the platform within the past four years.
Business accounts on Instagram grew by 4.6% compared to 2024.
Creator accounts saw a 9% rise in the past year.
The average number of posts per user increased by 3.2% year over year.
Instagram Business Profiles
There are over 250 million active business profiles on Instagram.
58% of Instagram users say they have visited a business profile in the past month.
Business profiles with complete contact details receive 23% more profile visits than those without.
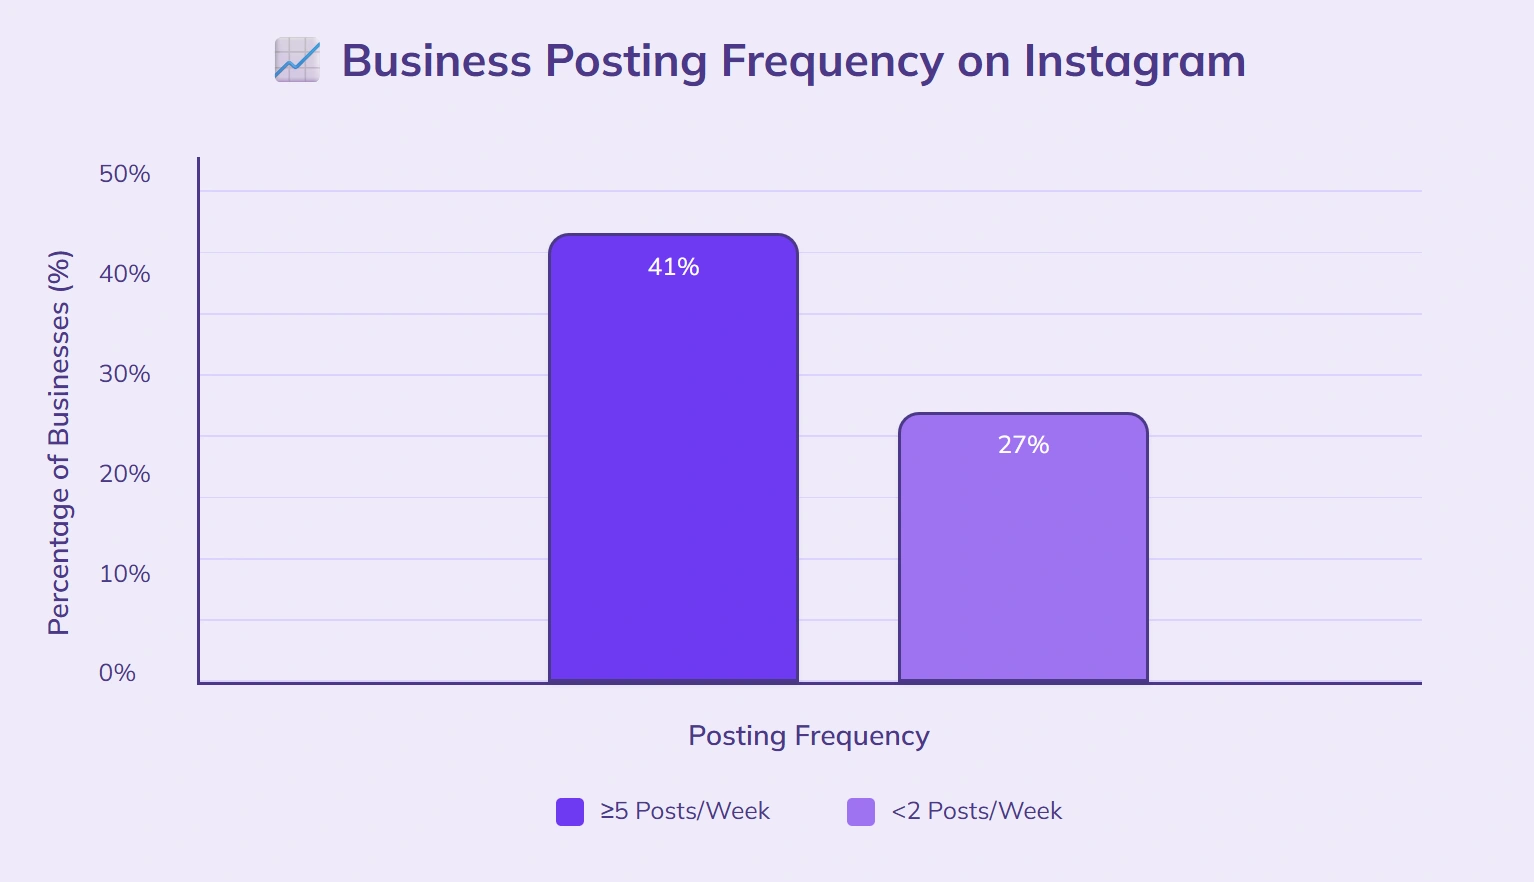
41% of business profiles post content at least five times per week, compared to 27% that post fewer than twice weekly.
62% of business accounts use Instagram Stories regularly, while 48% use Reels as part of their content strategy.
Around 33% of all Instagram ads are run from business profiles with under 10,000 followers.
Business profiles with active Stories highlights see 17% higher engagement rates.
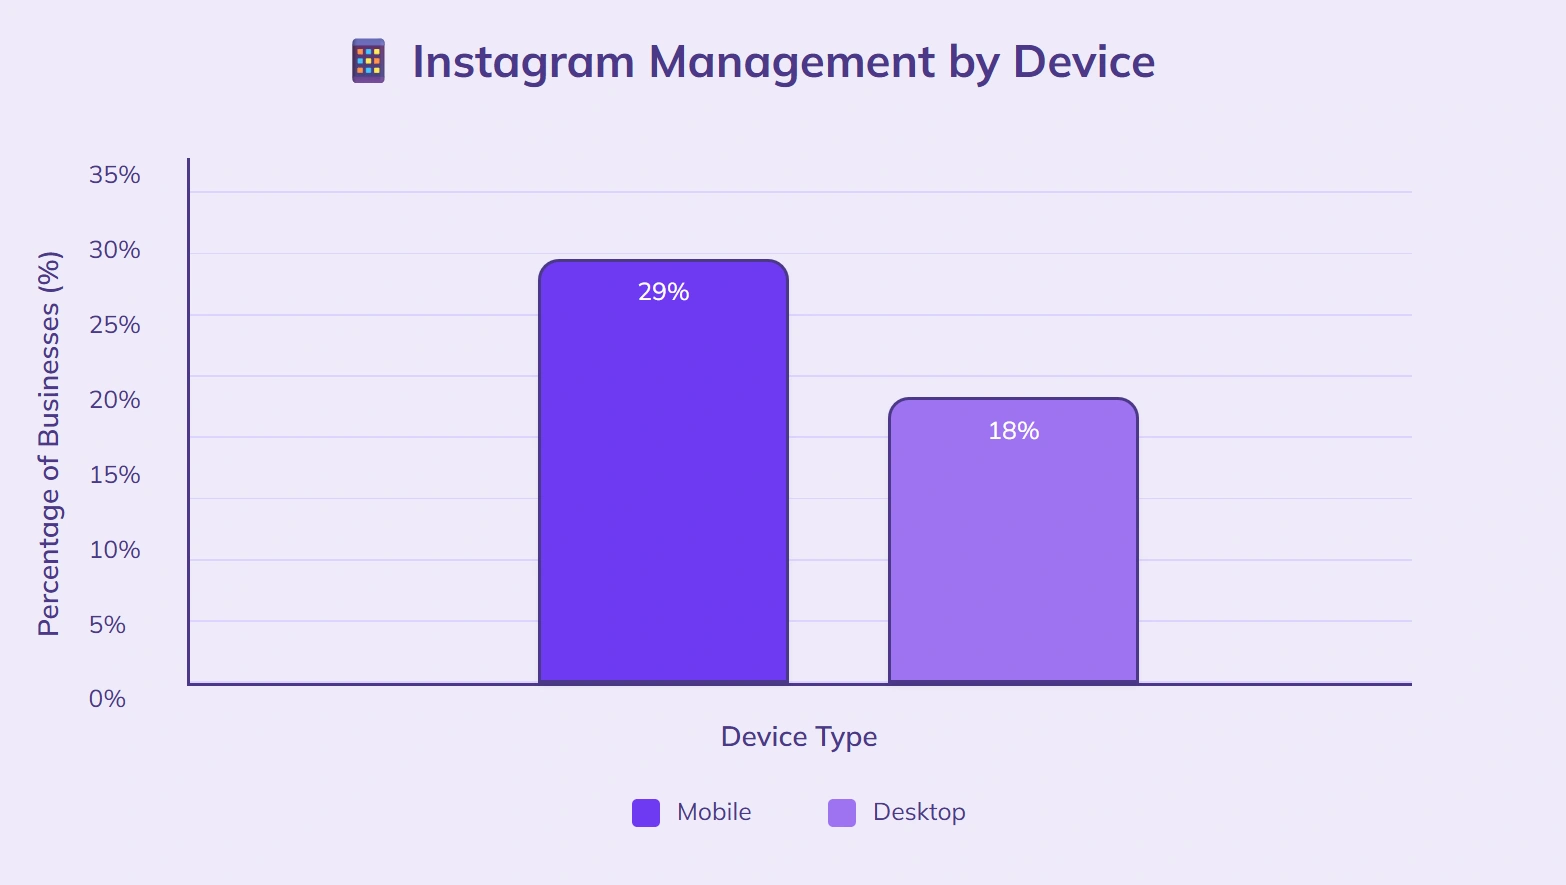
29% of business accounts manage their Instagram presence exclusively via mobile, compared to 18% that use desktop tools.
47% of small business accounts respond to customer DMs within one hour.
Verified business accounts experience an average of 21% more profile follows per month than non-verified accounts.
Instagram Engagement Rates
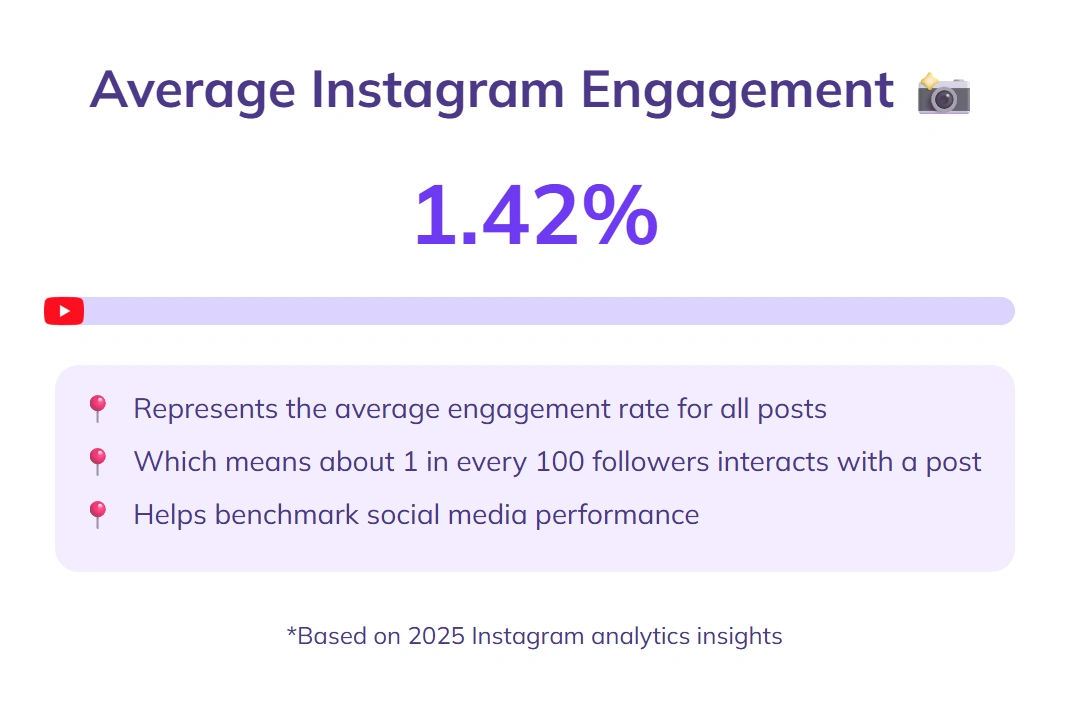
The average engagement rate for all Instagram posts is 1.42%.
Carousel posts achieve an average engagement rate of 1.92%, compared to 1.38% for photo posts.
Video posts generate 1.64% engagement on average, while Reels reach 2.05%.
Accounts with under 10,000 followers see average engagement rates of 3.8%, compared to 1.1% for accounts with over 1 million followers.
Posts published between 6 p.m. and 8 p.m. see 12% higher engagement than those posted during working hours.
Hashtags increase post engagement by an average of 4.2%.
Stories with interactive stickers see 15% more taps and replies than those without.
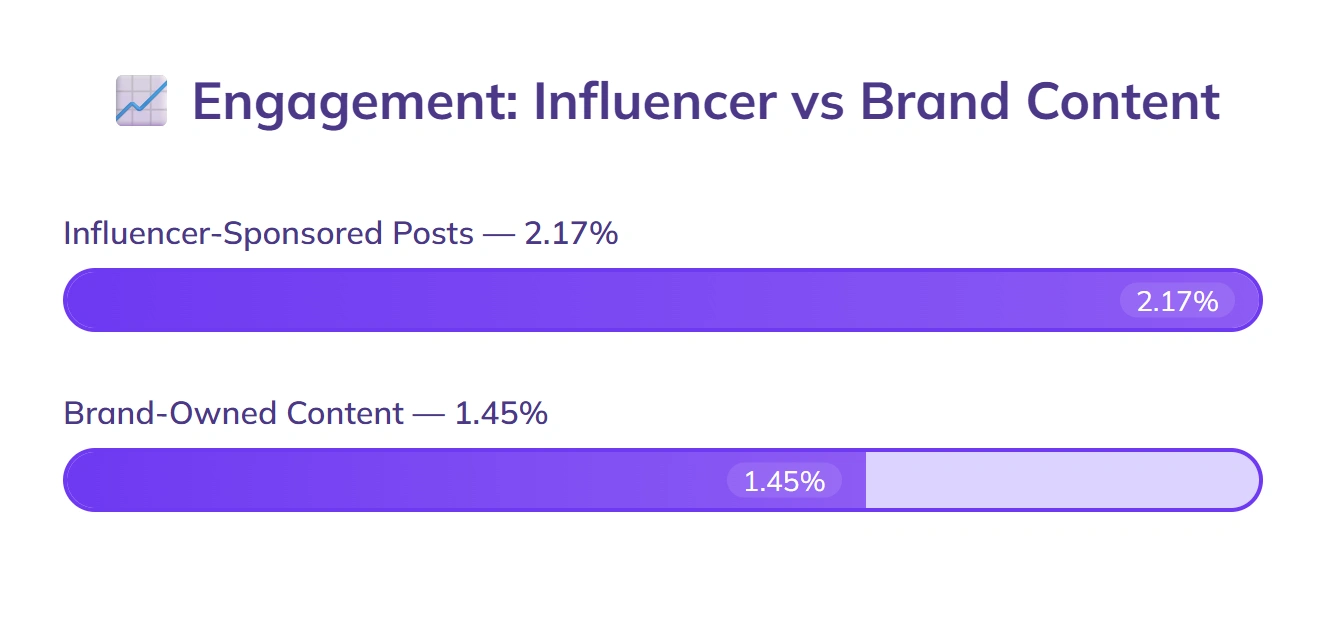
Influencer-sponsored posts average 2.17% engagement, compared to 1.45% for brand-owned content.
Engagement rates for Instagram Live sessions average 0.91%, with higher participation in Q&A formats.
Posts featuring people’s faces receive 27% more likes than those without.
Instagram Stories Performance
68% of Instagram users watch Stories daily.
Stories have an average completion rate of 74% for sequences under four frames.
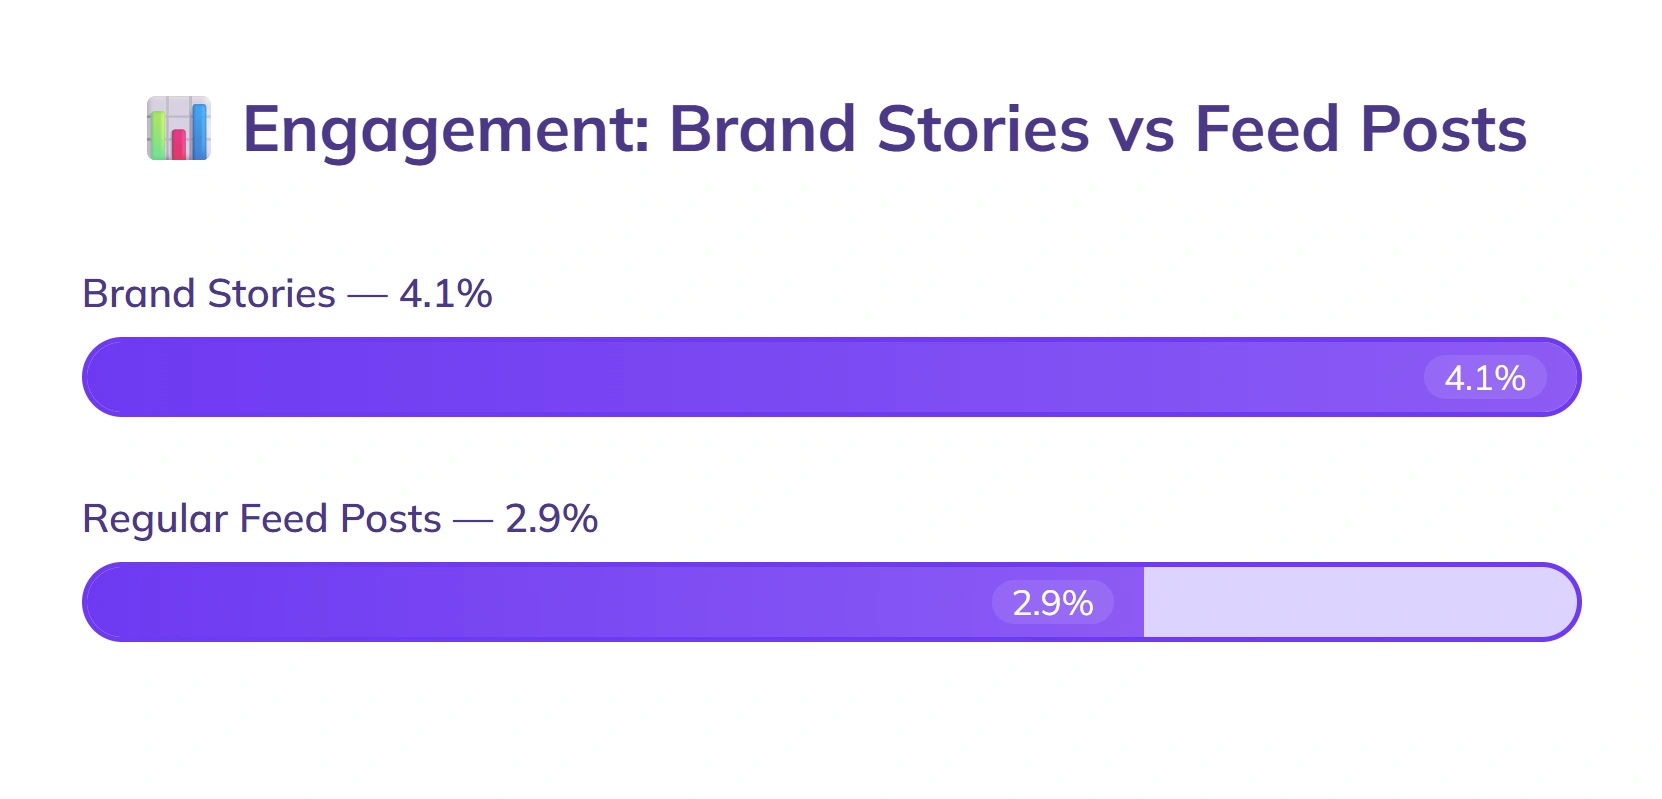
Brand Stories see an average engagement rate of 4.1%, compared to 2.9% for regular feed posts.
Stories with a poll sticker have 21% higher interaction rates than those without interactive elements.
35% of users say they have swiped up on a Story link in the past month.
Video-based Stories have a 12% higher tap-forward rate than photo-only Stories.
Stories with captions see 18% more views completed to the end than Stories without text.
Sponsored Stories generate an average click-through rate of 0.76%, compared to 0.54% for feed ads.
46% of business accounts post Stories at least three times per week.
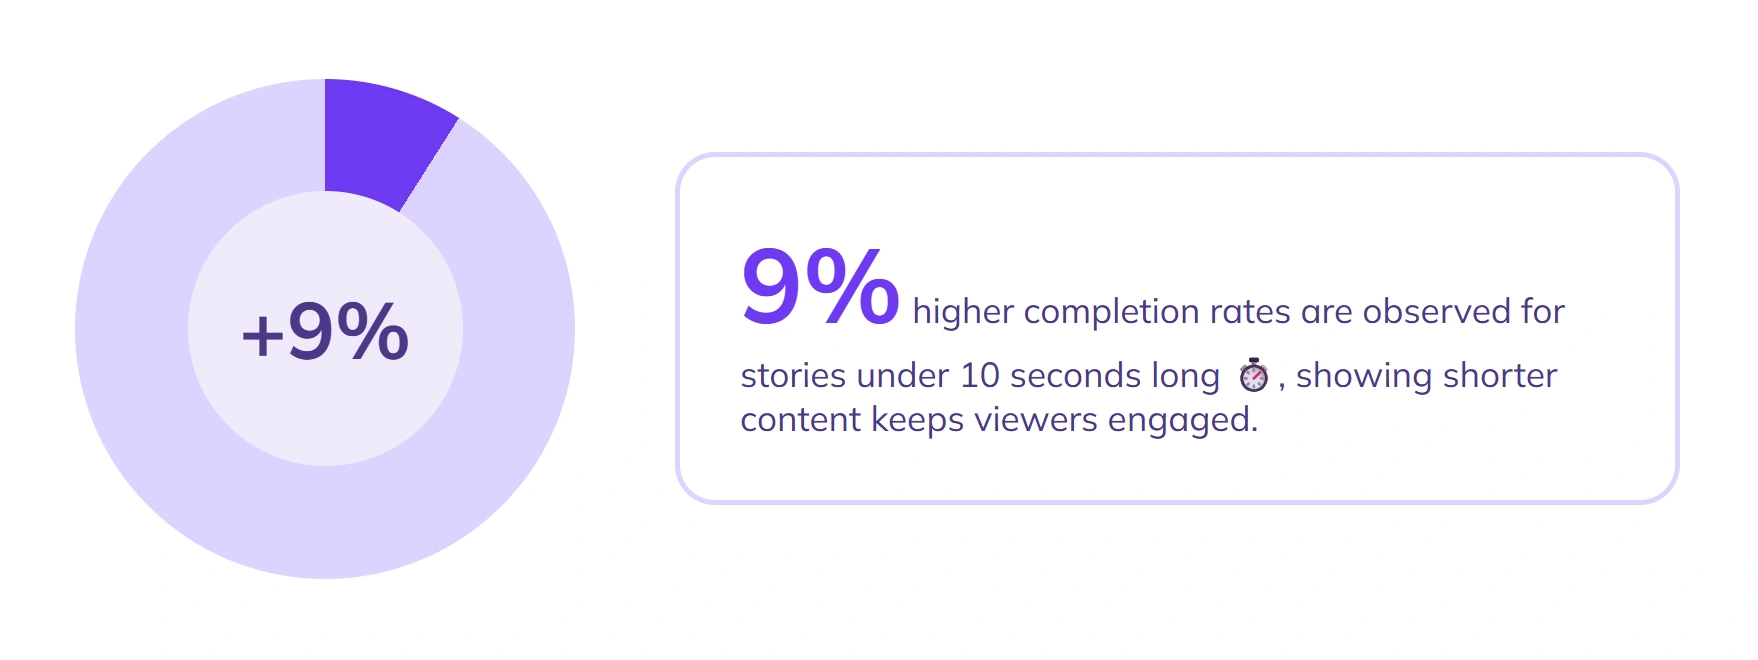
Stories under 10 seconds long have 9% higher completion rates than longer ones.
Instagram Video Marketing
54% of Instagram users watch at least one video on the platform every day.
Video posts receive 38% more engagement on average compared to photo posts.
Reels account for 43% of all video views on Instagram, while Stories make up 37%.
Across Meta’s apps, Reels now drive more than 140 billion plays per day, making short-form video the center of Instagram’s growth.
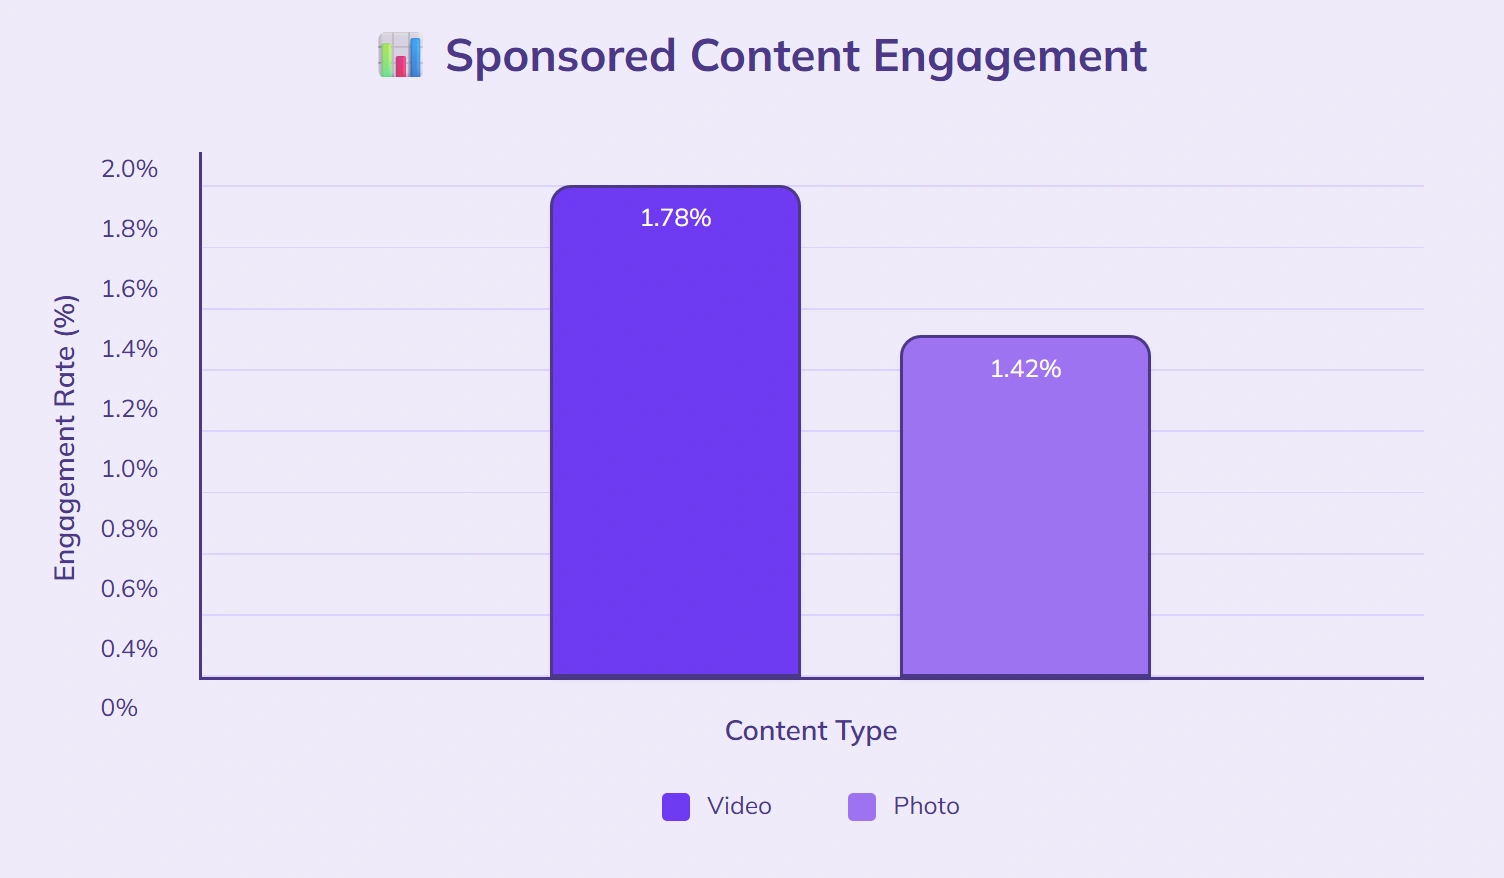
Sponsored videos have an average engagement rate of 1.78%, compared to 1.42% for sponsored photo posts.
29% of users say they have purchased a product after watching a video ad on Instagram.
Videos under 30 seconds retain 81% of viewers until the end, compared to 52% for videos over one minute.
Square format videos achieve 14% higher engagement than landscape format videos.
Live videos on Instagram average 0.91% engagement, with Q&A sessions outperforming tutorials by 23%.
According to Instagram Reel statistics, 64% of marketers on Instagram say, Reels deliver the highest return on ad spend compared to other video formats.
Videos with captions see 19% higher view completion rates than videos without captions.
Instagram Shopping & eCommerce
32% of Instagram users have made a purchase directly through the app in the past month.
Shoppable posts generate 24% more engagement on average compared to non-shoppable posts.
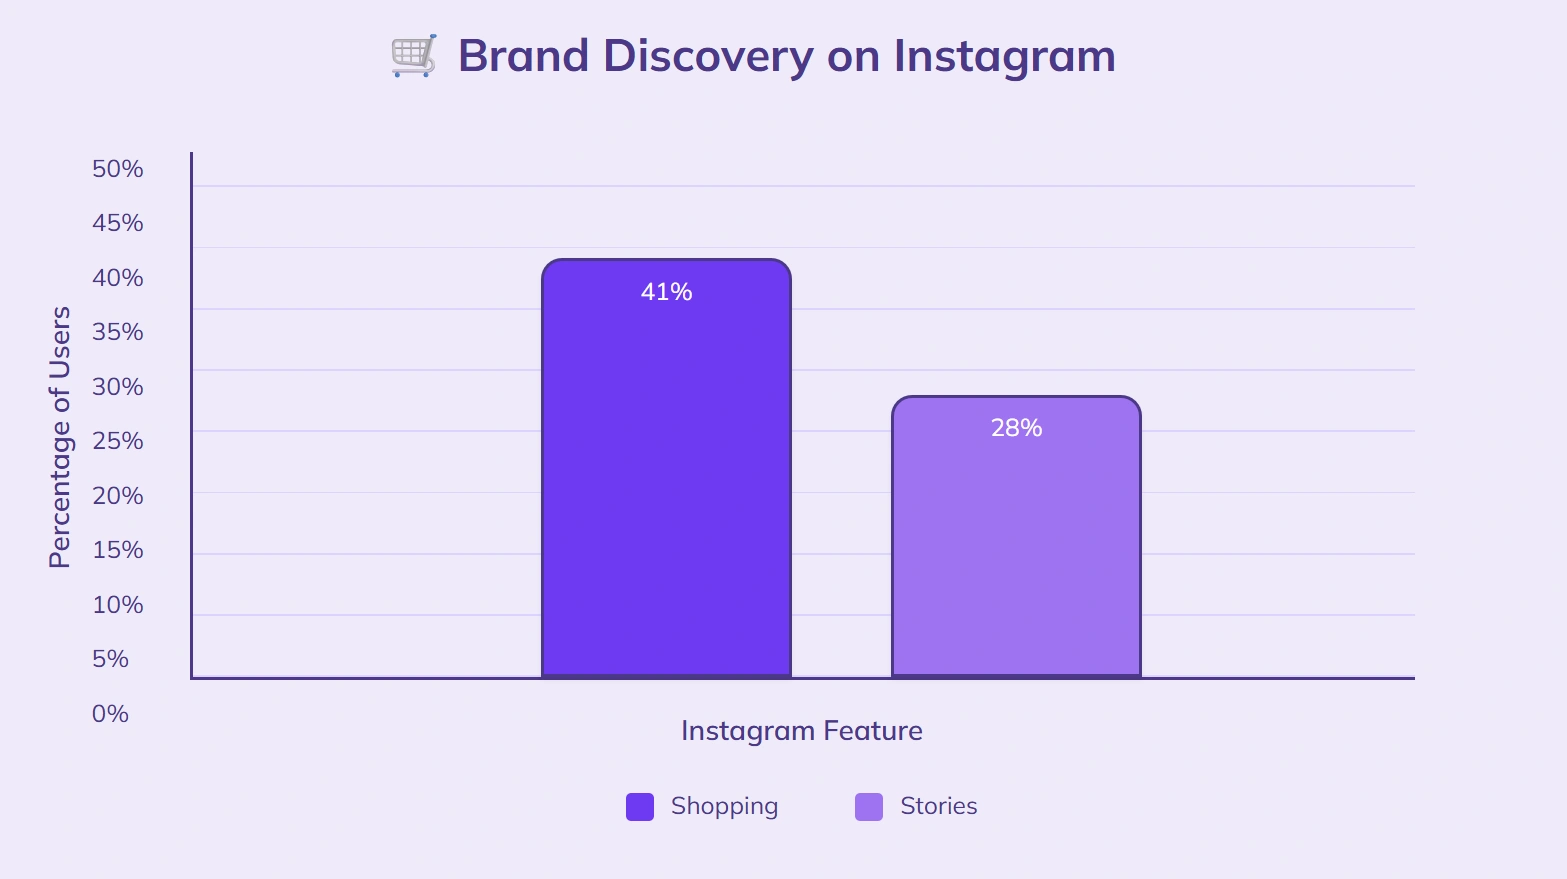
41% of users have discovered a new brand through Instagram Shopping, compared to 28% through Stories.
56% of Instagram shoppers say they prefer buying from small businesses featured on the platform.
Product tags in feed posts increase click-through rates by 17%.
Instagram Shops with at least 50 products listed have 12% higher sales than those with smaller inventories.
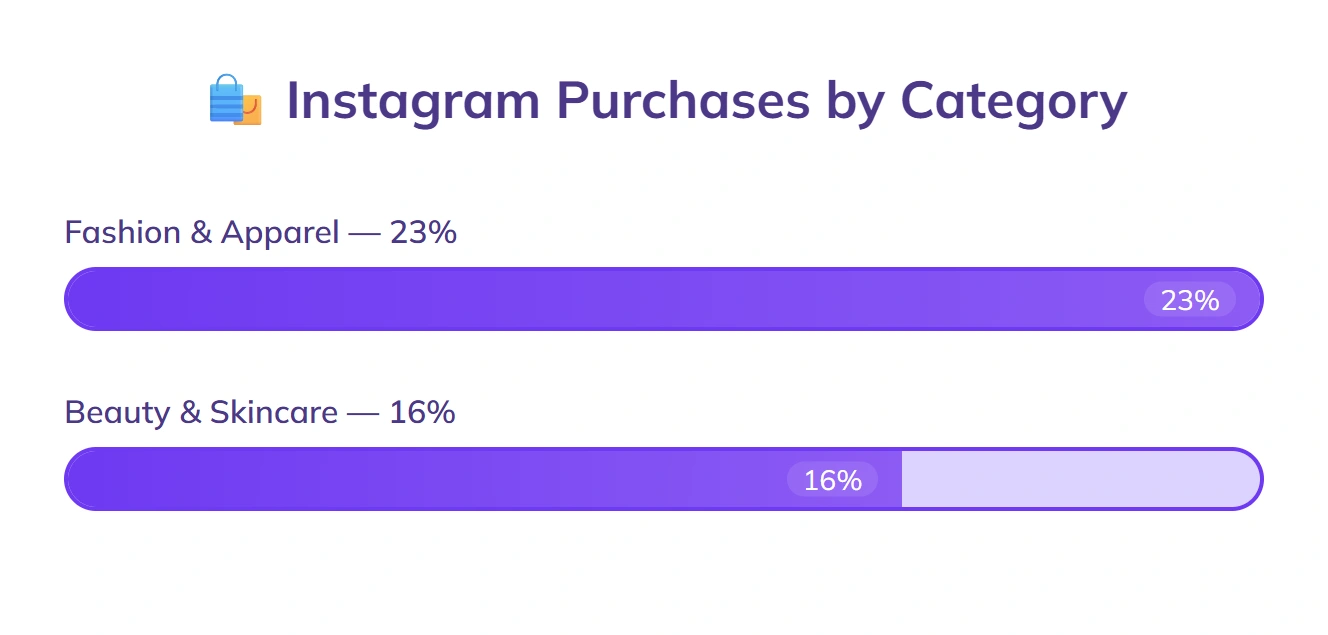
23% of all purchases made through Instagram are from fashion and apparel brands, while 16% are from beauty and skincare.
Limited-time offers promoted via Stories drive 27% more sales than regular promotions.
35% of eCommerce brands on Instagram run paid campaigns specifically for product launches.
Carousel ads featuring product collections achieve 18% higher conversion rates than single-image ads.
Instagram Hashtag Statistics
Posts with at least one hashtag average 4.2% higher engagement than those without.
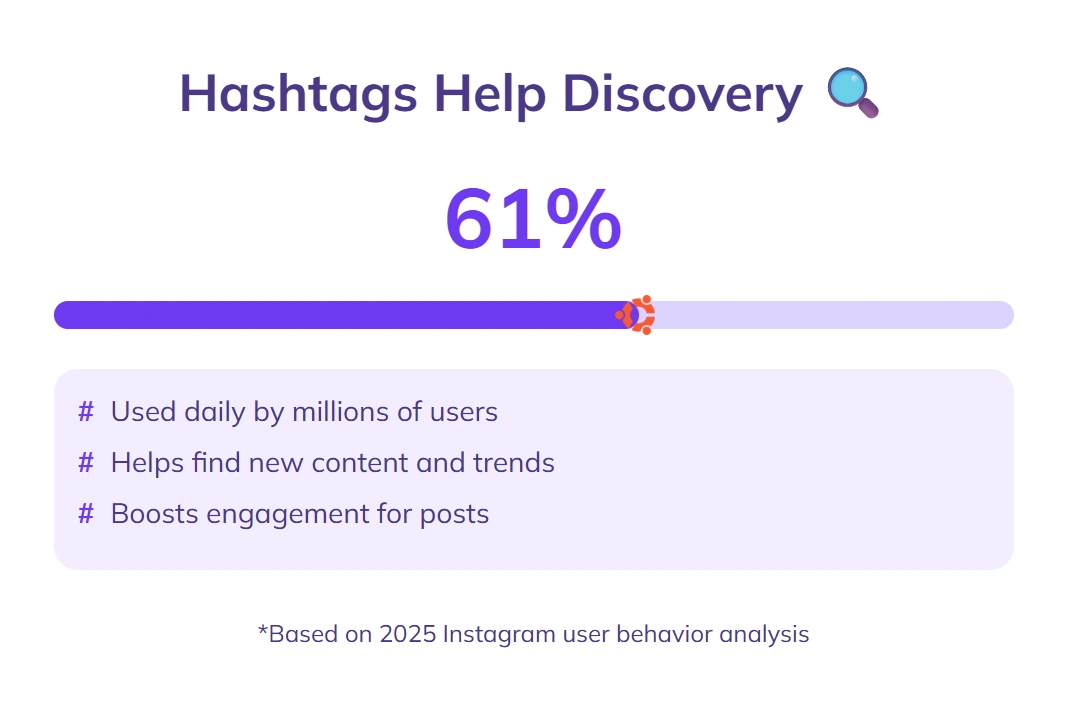
61% of Instagram users say they use hashtags to discover new content.
Posts with 11 or more hashtags receive 16% more interactions than those with fewer than five.
37% of branded hashtags generate over 1,000 uses within the first month of launch.
Posts containing trending hashtags gain 22% more reach compared to non-trending hashtags.
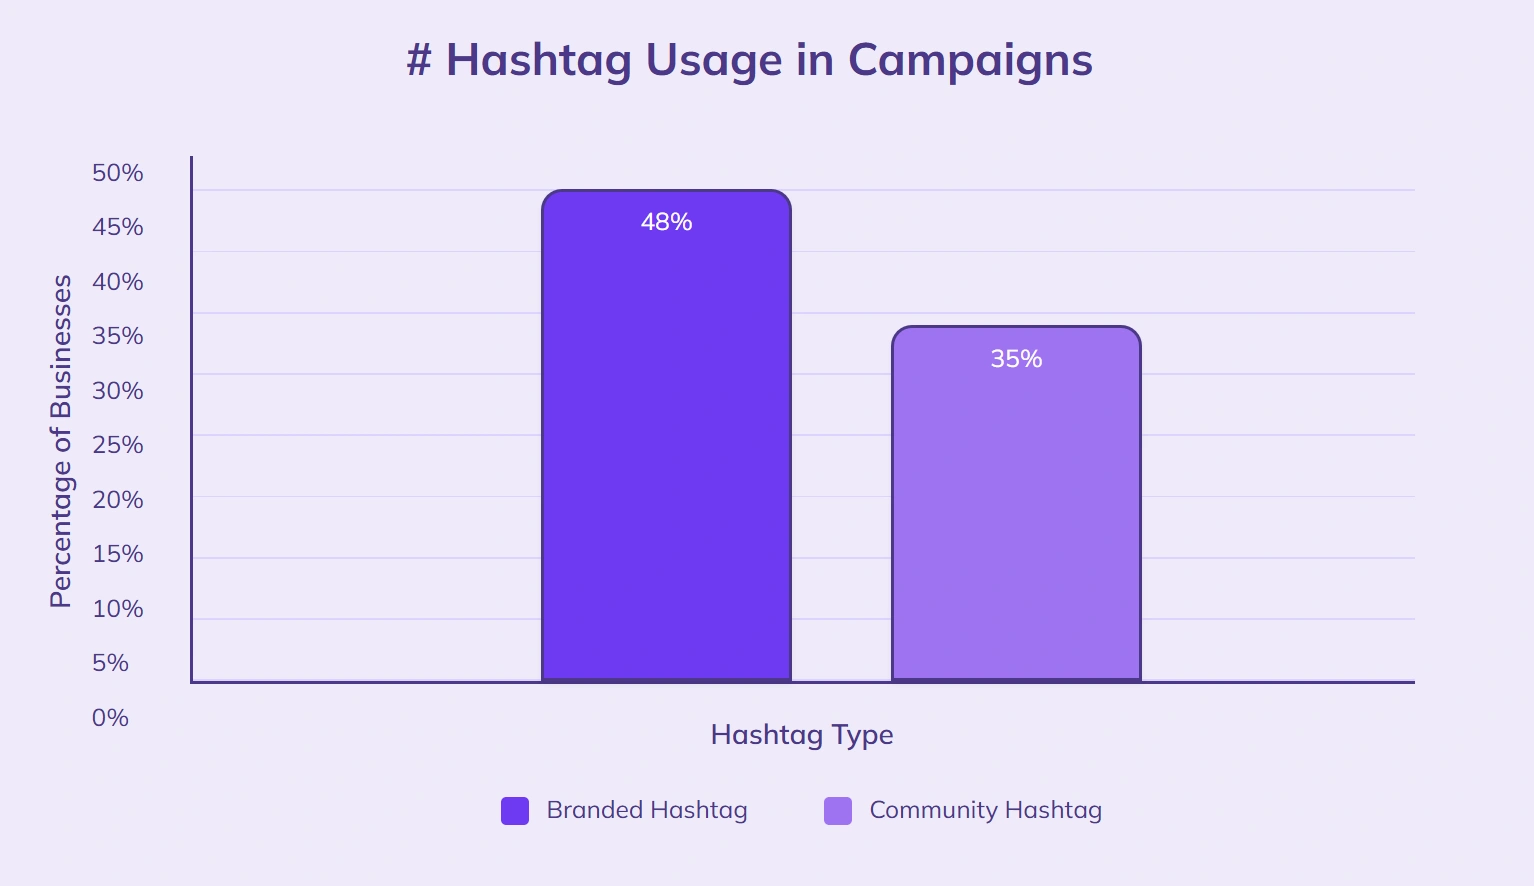
48% of businesses create their own branded hashtag for campaigns, while 35% rely on popular community hashtags.
Using location-based hashtags increases engagement by 14% compared to generic hashtags.
19% of users follow at least one hashtag on Instagram.
Carousel posts with hashtags in the first comment perform 7% better than those with hashtags in the caption.
Posts that mix branded and generic hashtags receive 13% more engagement than posts using only one type.
AI Influencers & Faceless Accounts on Instagram
Faceless Instagram accounts using trending Reels formats grow followers 37% faster than accounts that rely only on traditional photo posts.
Campaigns featuring AI influencers deliver a 12–15% lower cost per engagement compared to campaigns with human creators.
46% of Gen Z Instagram users say they are open to following AI-created influencers if the content feels authentic.
Faceless meme-style accounts drive 60% more shares per post than personal brand accounts on Instagram.
AI influencer campaigns generate 25% more saves than human influencer campaigns in industries like fashion and beauty.
Instagram Algorithm Insights
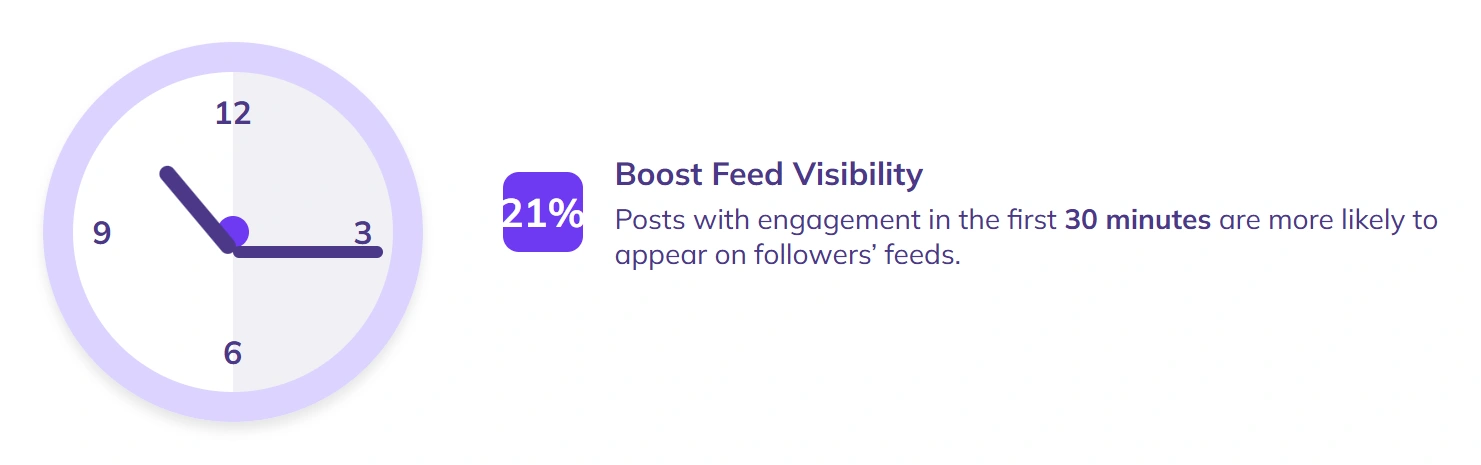
Posts that receive engagement within the first 30 minutes are 21% more likely to appear on followers’ feeds.
54% of content shown on the Explore page comes from accounts the user does not follow.
Carousel posts are 23% more likely to be boosted by the algorithm than single-image posts.
42% of users say they often see posts from the same five accounts in their feed.
Videos under 60 seconds are favored by the algorithm 17% more than longer videos.
Posts with a mix of photo and video content in the same week see 14% higher reach compared to accounts posting only one format.
68% of content in Reels recommendations comes from accounts outside the user’s following list.
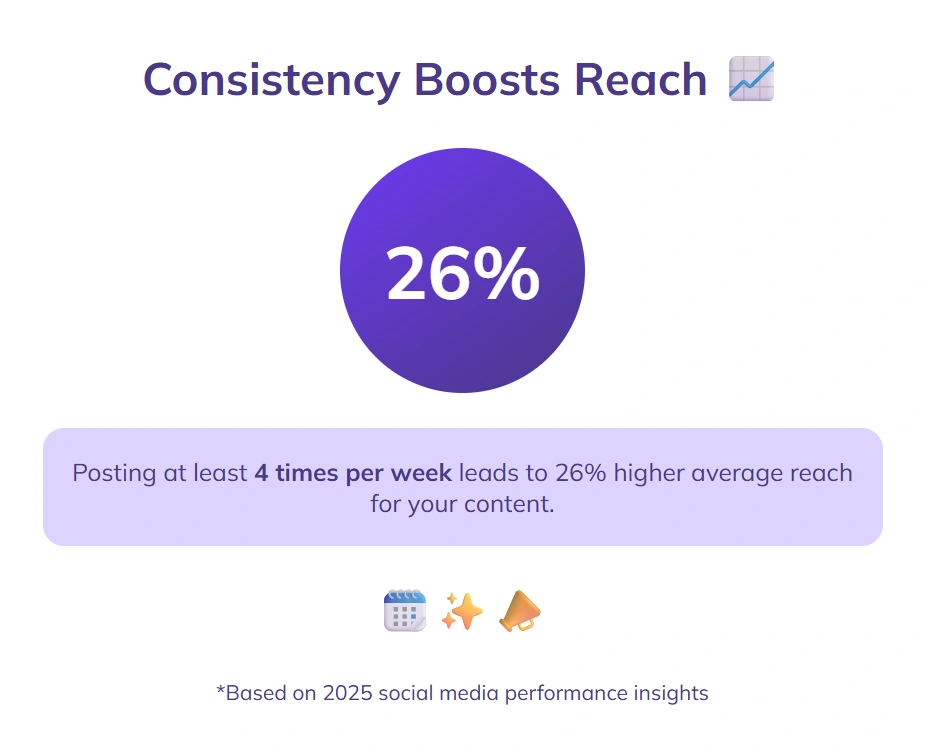
Consistent posting (at least 4 times per week) leads to 26% higher average reach.
Posts that include both hashtags and location tags are 19% more likely to appear in search results than posts with only one of the two.
35% of accounts report seeing a reach boost after engaging with followers in comments within an hour of posting.
Instagram Influencer Marketing
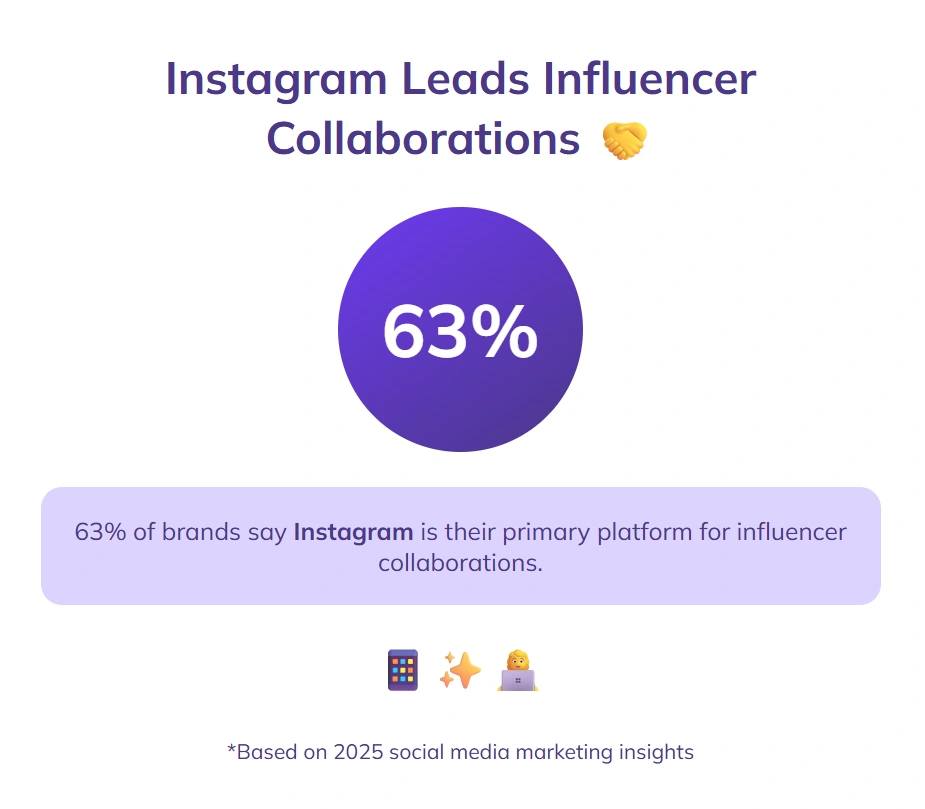
63% of brands say Instagram is their primary platform for influencer collaborations.
Micro-influencers (10k–100k followers) deliver engagement rates 41% higher than macro-influencers (100k+ followers).
Sponsored posts make up 18% of all influencer content on Instagram.
Influencer campaigns that use Reels see 27% more reach than those using static posts.
56% of users report purchasing a product after seeing it promoted by an influencer they follow.
Brands offering both free products and payment get 22% higher campaign participation from influencers compared to brands offering only one incentive.
Beauty and fashion collaborations make up 48% of all influencer campaigns on Instagram.
39% of influencers say they prefer long-term brand partnerships over one-off deals.
Campaigns with influencers who post at least twice during the collaboration achieve 25% higher conversion rates.
71% of influencers use Stories as part of their paid campaigns to boost visibility and engagement.
Instagram Ads Performance
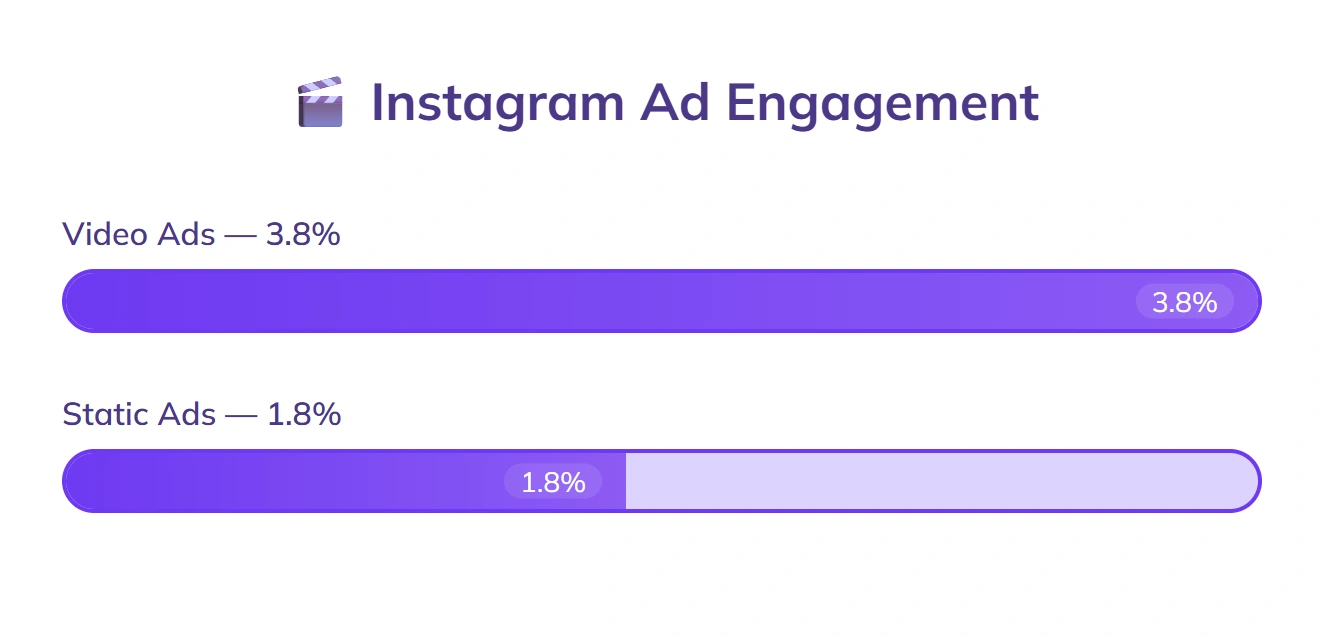
Video ads on Instagram get 3.8% engagement, compared to 1.8% for static ads.
Carousel ads achieve a 2.5% click-through rate, while single-image ads average 1.9%.
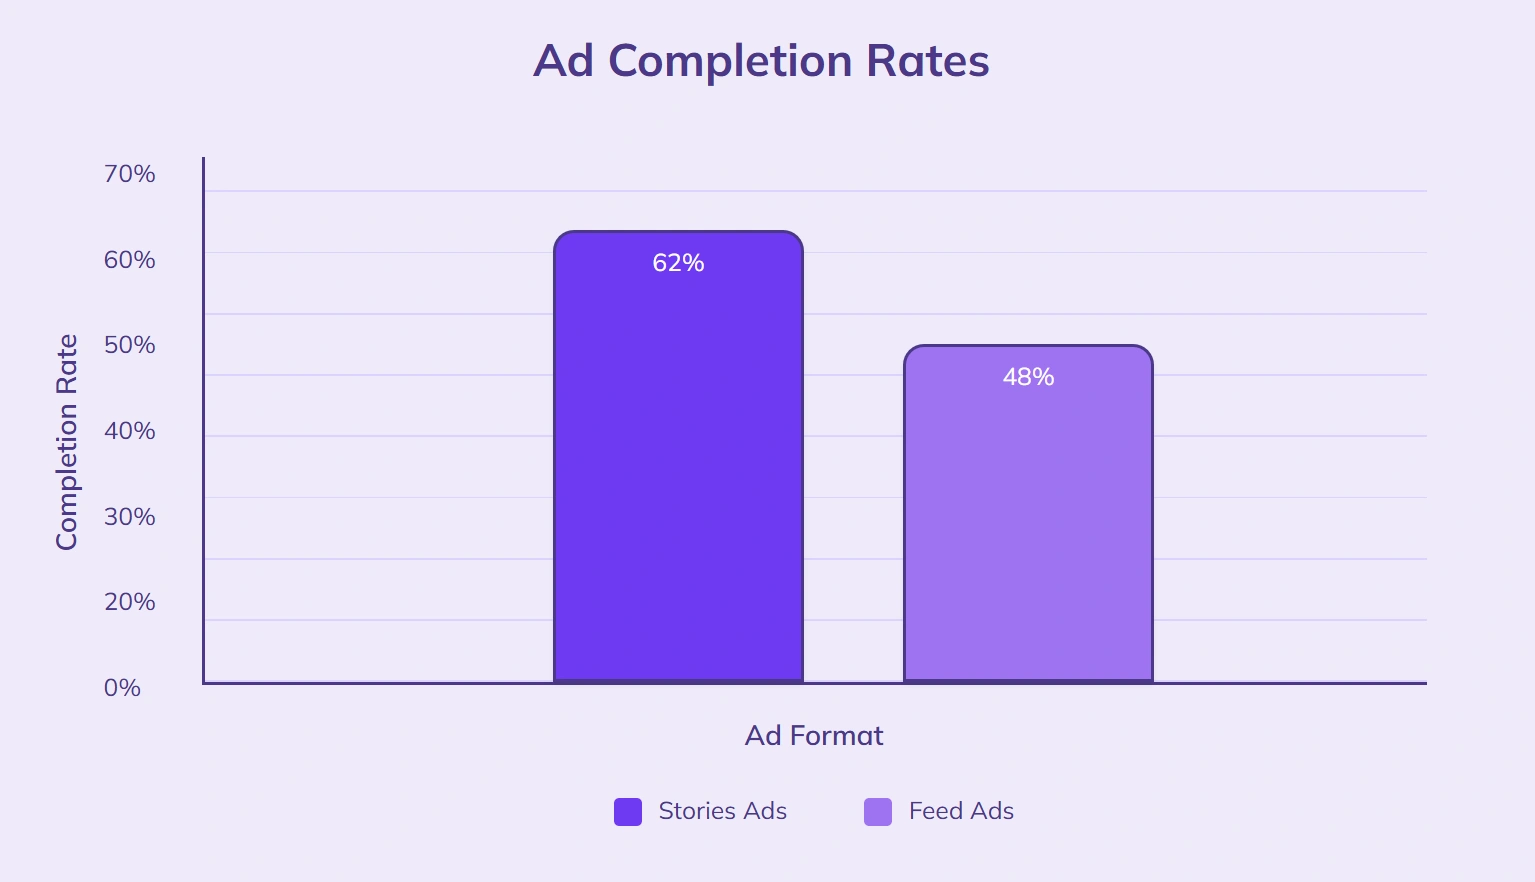
Story ads are viewed to completion 62% of the time, compared to 48% for feed ads.
Sponsored posts on Instagram have an average engagement rate of 2.2%.
Ads with captions under 125 characters see a 14% higher engagement rate.
Interactive poll stickers in Stories ads increase engagement by 19%.
Photo ads with a clear call-to-action button get 1.6x more clicks than those without.
The average cost-per-click for Instagram ads is $1.05.
Ads featuring people’s faces get 22% more likes than ads without faces.
Vertical video ads have a 27% higher completion rate than horizontal video ads.
Instagram Content Types
Photo posts make up 46% of all content shared on Instagram.
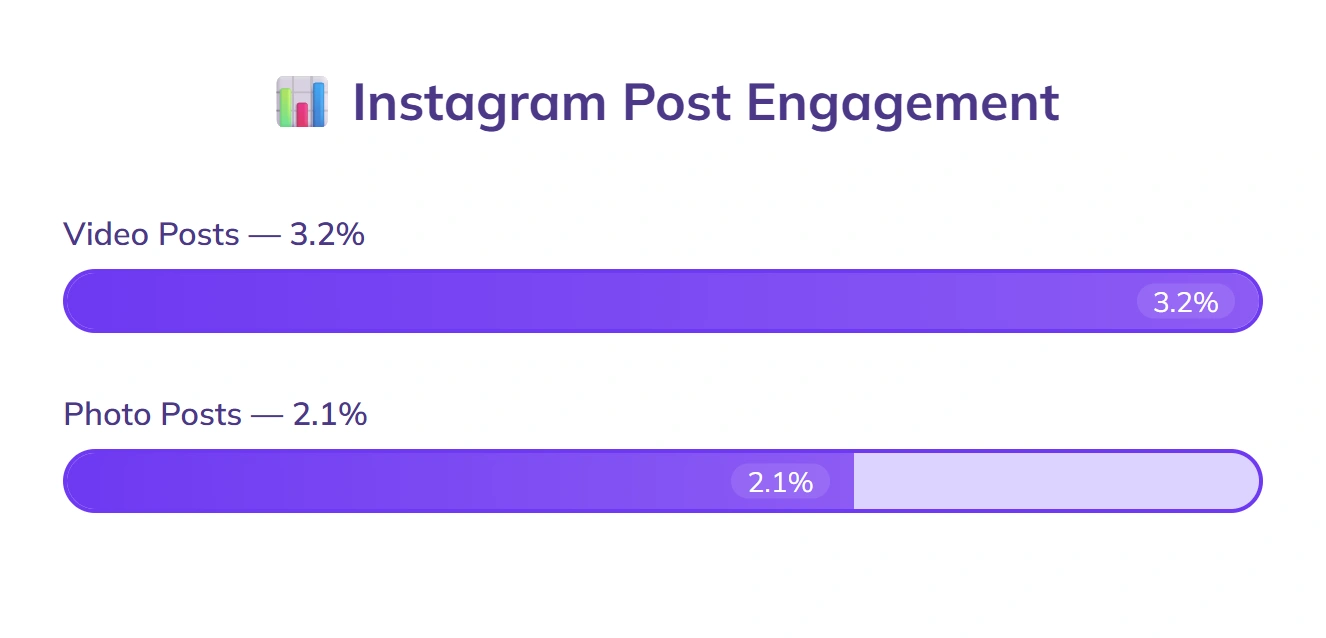
Video posts receive an average engagement rate of 3.2%, compared to 2.1% for photos.
Carousel posts generate 1.4x more saves than single-photo posts.
Reels account for 22% of total content uploaded each month.
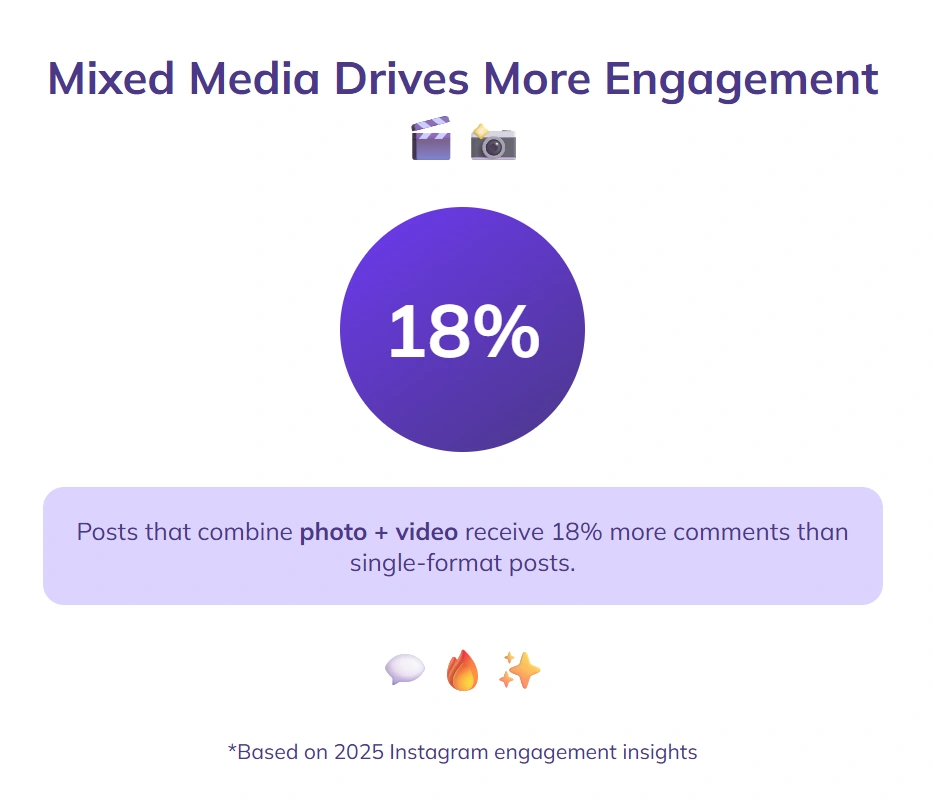
Posts with mixed media (photo + video) get 18% more comments than single-format posts.
Stories make up 34% of total daily uploads on the platform.
Live videos average 6.5 minutes in duration.
Memes receive 12% more shares than standard image posts.
Infographic posts are saved 24% more often than non-informational images.
Posts with user-generated content have a 3.6% engagement rate.
Instagram Captions & CTAs
Posts with captions longer than 100 words receive 23% more comments, averaging 12 comments versus 10 comments for shorter captions.
Captions with emojis have a 15% higher engagement rate, averaging 11.5% engagement.
Questions in captions increase comment volume by 21%, averaging 12.1 comments.
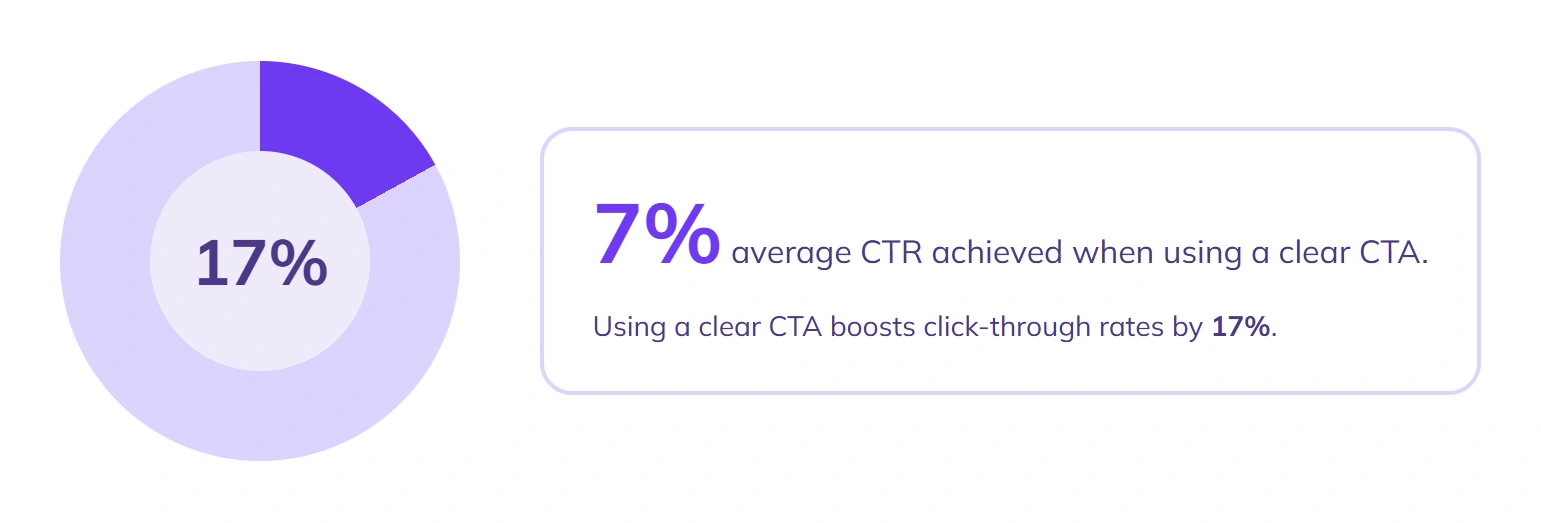
Using a clear CTA boosts click-through rates by 17%, averaging 7% CTR.
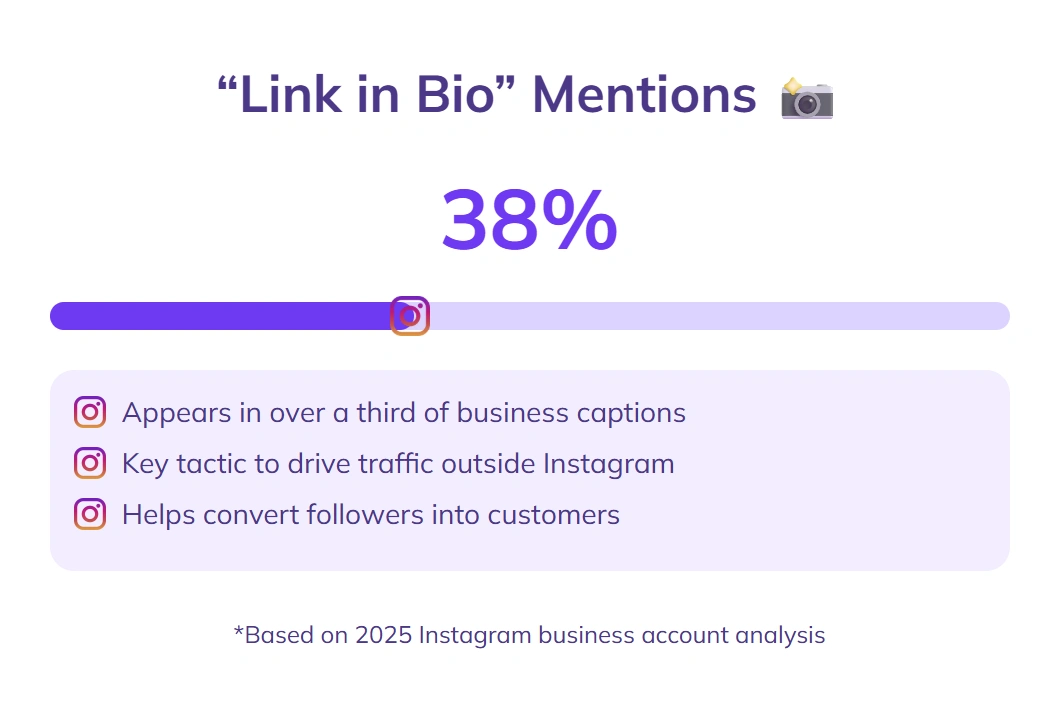
“Link in bio” mentions appear in 38% of all business account captions.
Posts ending with a question generate 19% more saves, averaging 11.4 saves versus 9.6 saves for posts without a closing prompt.
Captions containing a brand’s slogan get 12% more shares, averaging 5.6 shares.
Giveaways with “tag a friend” CTAs lead to 28% more comments, averaging 12.8 comments versus 10 comments for regular promotional posts.
Short captions under 50 characters receive 8% more likes, averaging 108 likes.
Including “double tap” phrases in captions lifts engagement by 11%, averaging 11.1% engagement.
Instagram Audience Reach
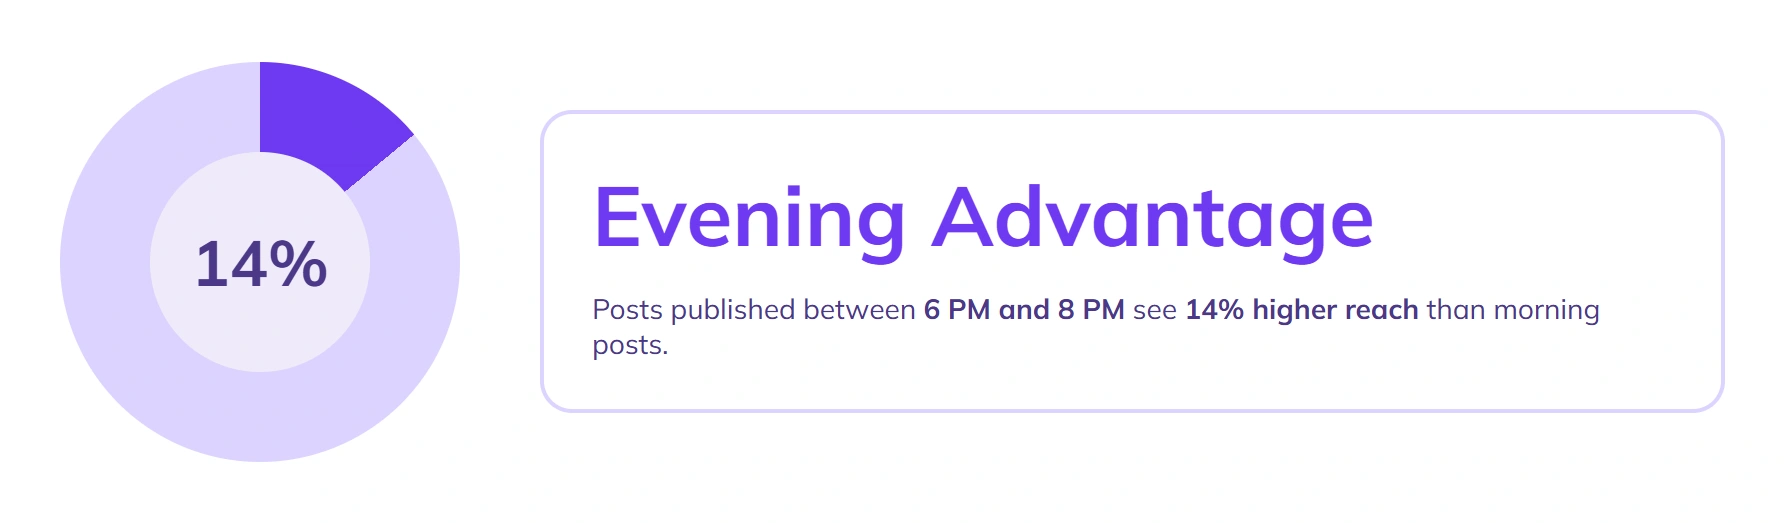
Posts published between 6 PM and 8 PM see 14% higher reach than those posted in the morning.
Carousel posts reach 12% more unique accounts than single-image posts.
Instagram Reels achieve 22% more reach than Stories on average.
Hashtags increase audience reach by 9% when used in captions compared to comments.
Location tags boost reach by 18% compared to posts without them.
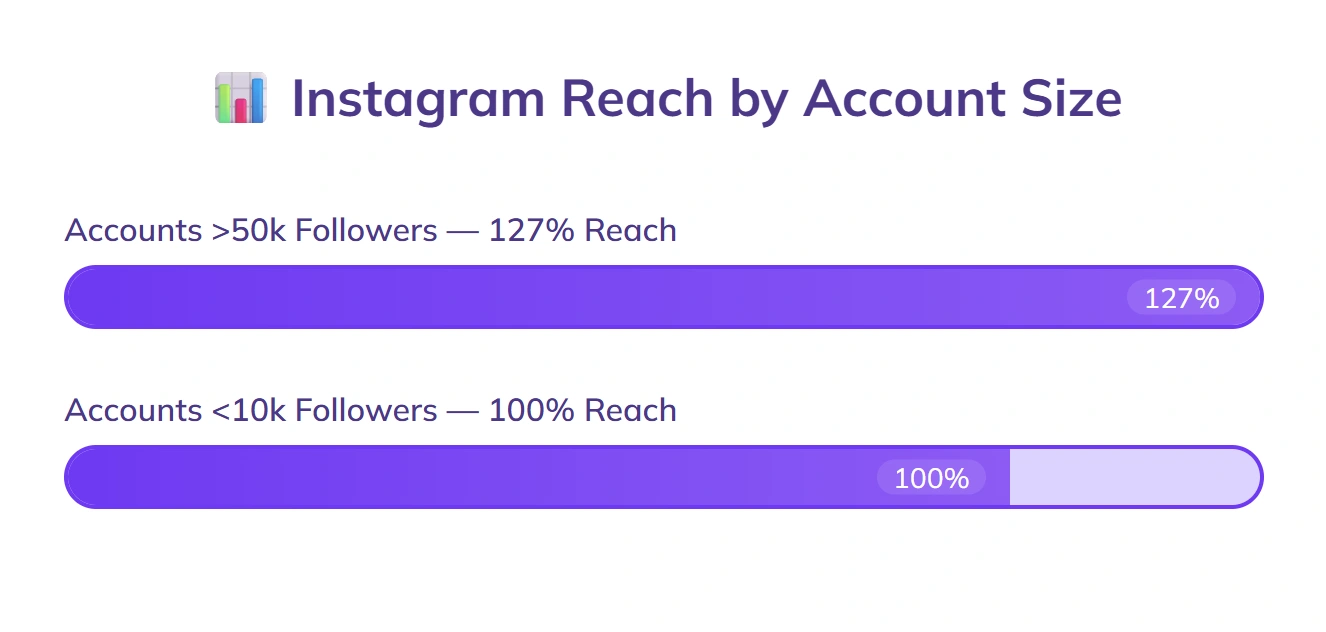
Business accounts with over 50k followers see 27% more reach per post than those with fewer than 10k.
Content shared to both Stories and Feed reaches 15% more accounts than feed-only posts.
Branded content posts have a 10% lower reach than organic posts.
Posting consistently 5+ times per week can increase average reach by 19%.
Engagement within the first 30 minutes can lift total reach by up to 20%.
Instagram Posting Frequency
Accounts posting once per day see 12% higher engagement than those posting twice per week.
Posting 3–4 times per week results in 8% higher reach than posting only once weekly.
Daily posting increases follower growth by 9% compared to posting 2–3 times weekly.
Business accounts that post more than 7 times per week have 14% lower engagement per post than those posting 3–5 times.
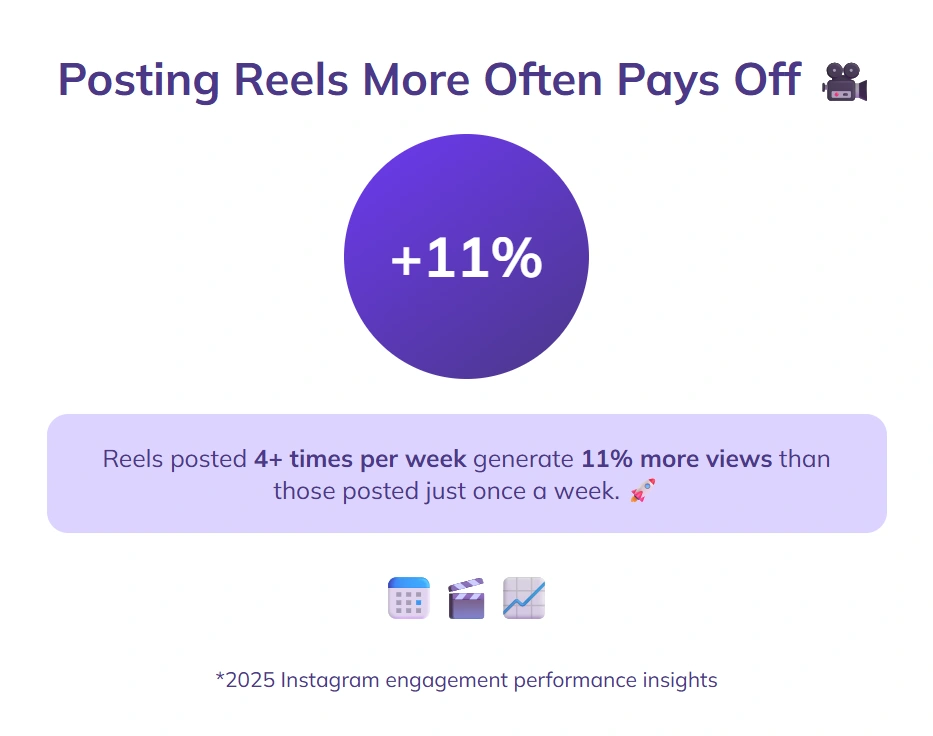
Reels posted 4+ times per week generate 11% more views than those posted once a week.
Posting on consecutive days can improve profile visits by 10%.
Accounts that skip posting for over 7 days see a 15% drop in average reach.
Sharing Stories at least 5 times per week boosts Story views by 13%.
Posting more than 2 times per day reduces average engagement per post by 6%.
Brands posting regularly for 30 days straight report a 17% increase in follower interactions.
Instagram Industry Benchmarks
The average engagement rate for the fashion industry is 0.9%.
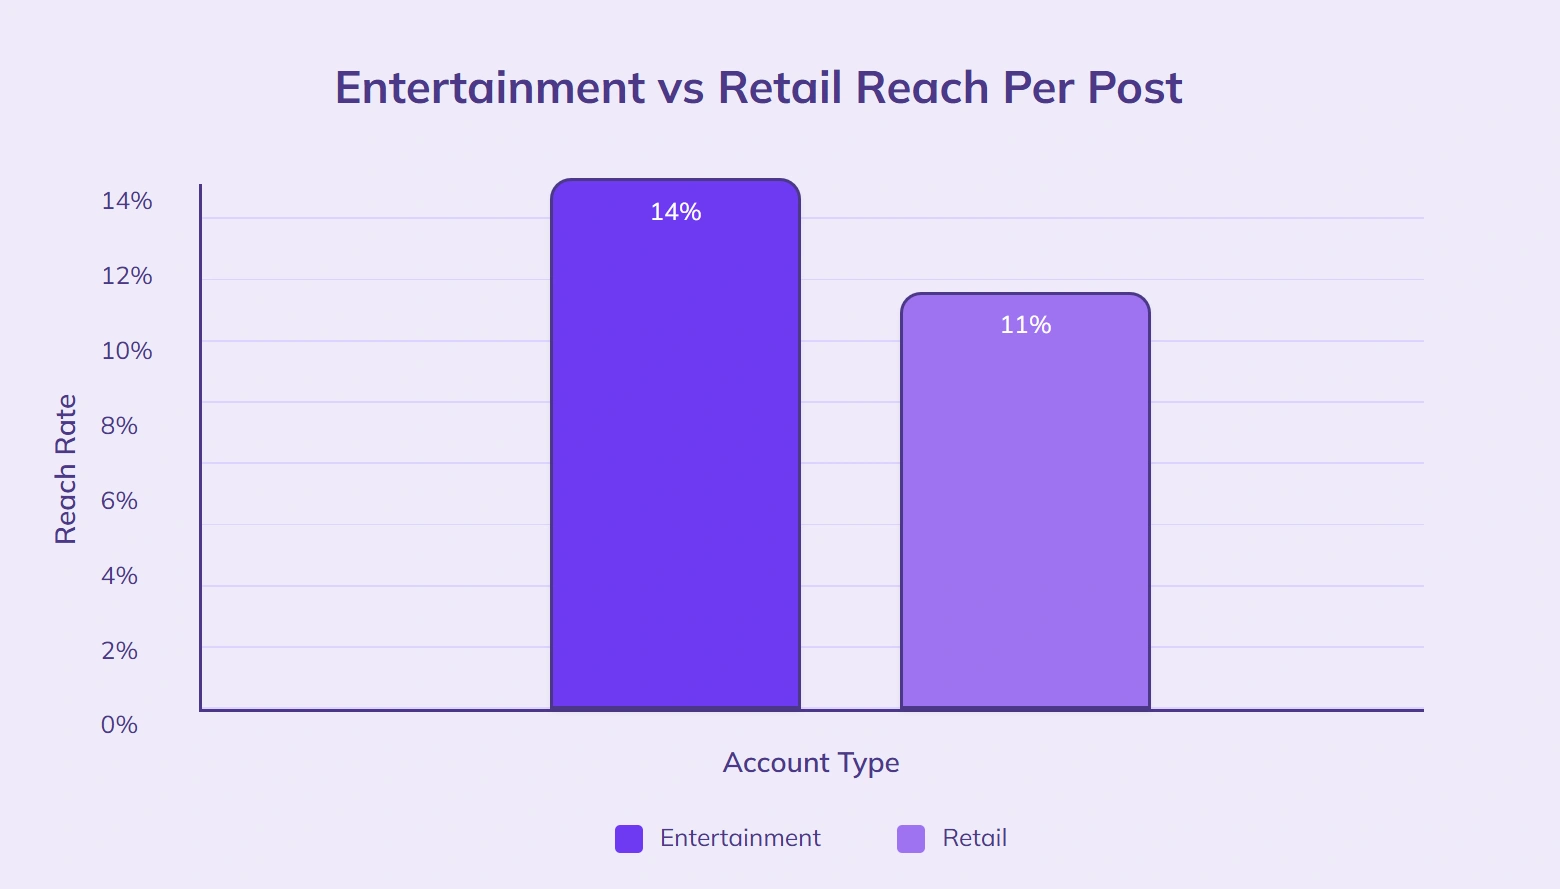
Travel brands see an average reach rate of 13% per post.
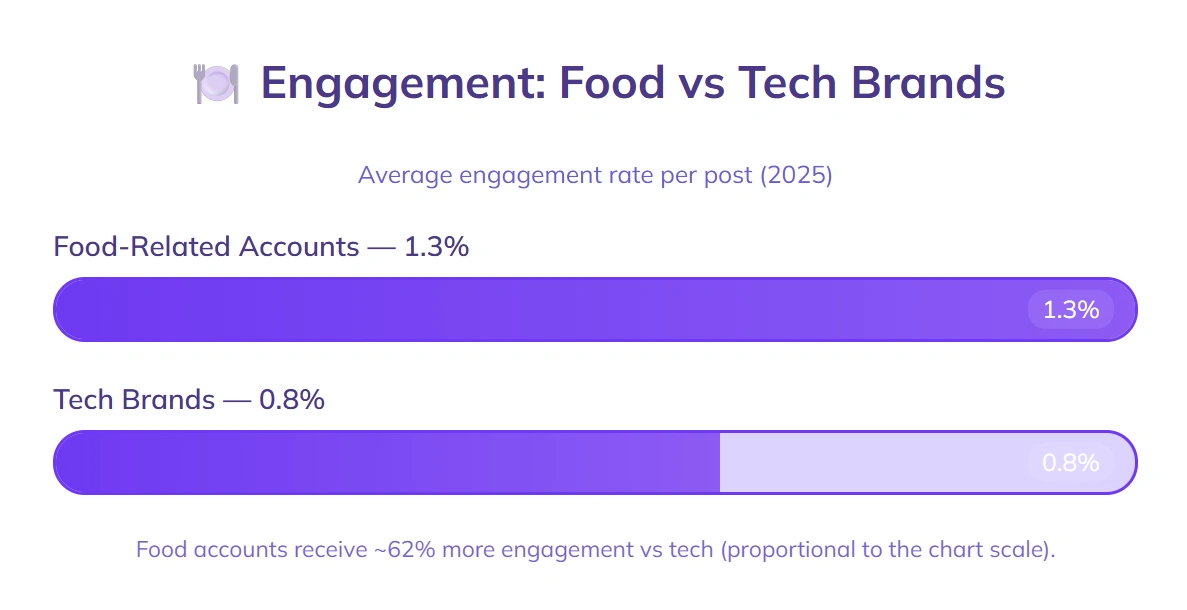
Food-related accounts average 1.3% engagement compared to 0.8% for tech brands.
Beauty brands achieve an average Story completion rate of 72%.
Beauty brand ad campaigns on Instagram average 1.6% engagement, roughly double the 0.8% the same campaigns average on Facebook.
Fitness influencers have an average engagement rate of 1.8%, higher than the overall industry average of 1.1%.
E-commerce accounts generate an average click-through rate of 0.7% on Instagram ads.
Nonprofit organizations see an average engagement rate of 1.5%.
Entertainment accounts average 14% reach per post compared to 11% for retail.
The education sector averages 0.6% engagement per post.
Hospitality brands receive an average of 4.2 comments per post.
Instagram vs Other Platforms
Instagram’s average engagement rate is 1.1%, compared to 0.6% on Facebook.
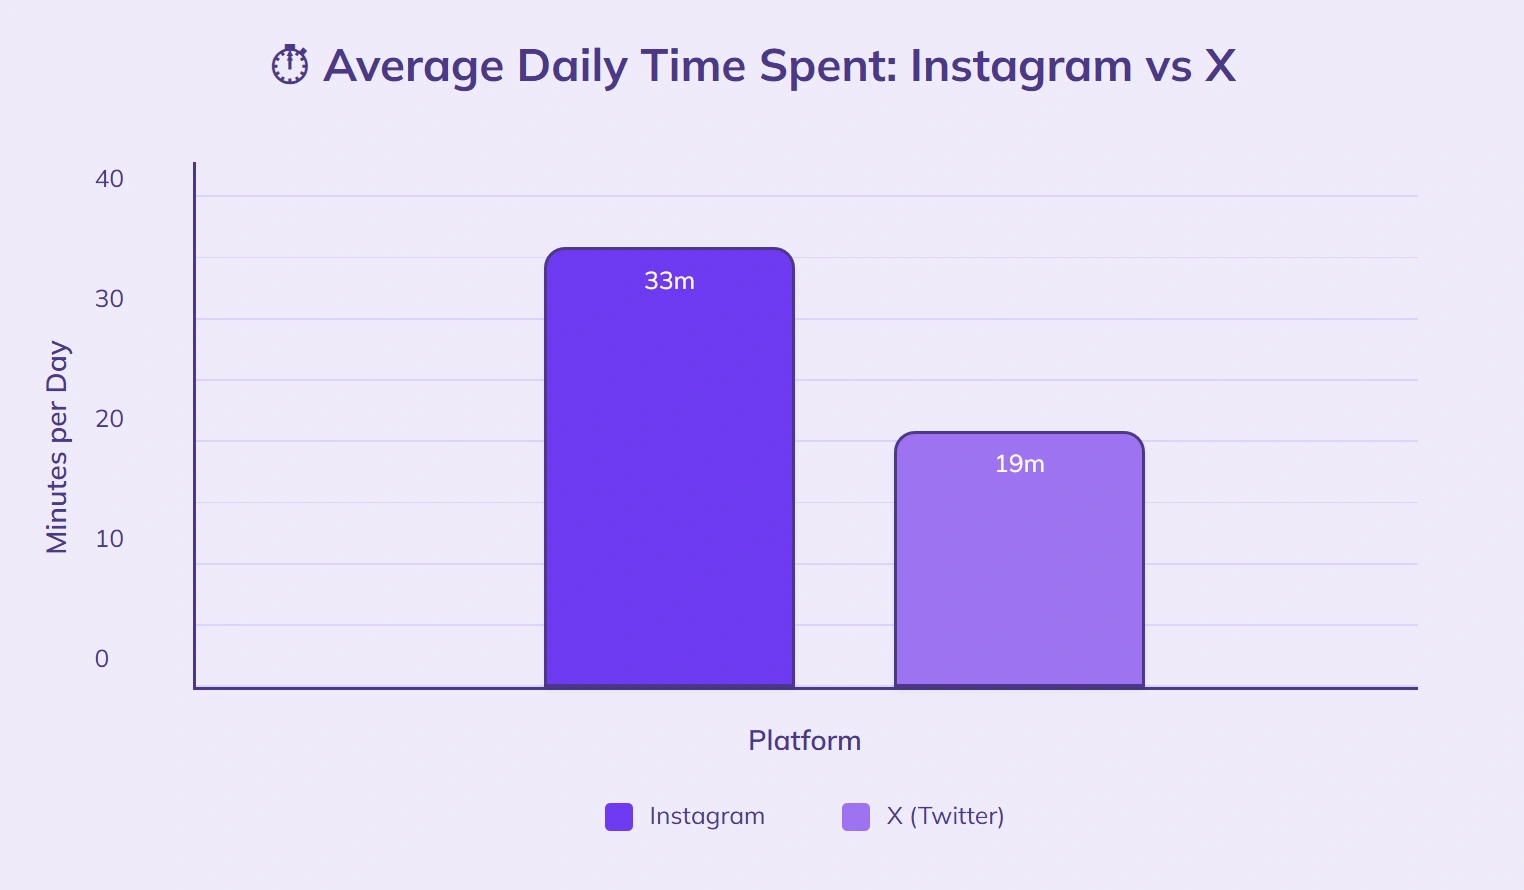
Users spend an average of 33 minutes per day on Instagram vs. 19 minutes on X (Twitter).
Instagram Stories are viewed by 62% of its active users daily, compared to 38% of Snapchat’s audience viewing Stories.
Video posts on Instagram get 2.3x more comments than video posts on LinkedIn.
Instagram ad click-through rate averages 0.9%, compared to 0.7% on TikTok.
54% of Instagram users discover new brands weekly, compared to 38% on Pinterest.
Instagram Reels' engagement rate is 1.8%, higher than TikTok’s 1.5%.
43% of Instagram users shop directly through the app, compared to 26% on Facebook.
Instagram has 2 billion monthly active users, while X (Twitter) has 619 million.
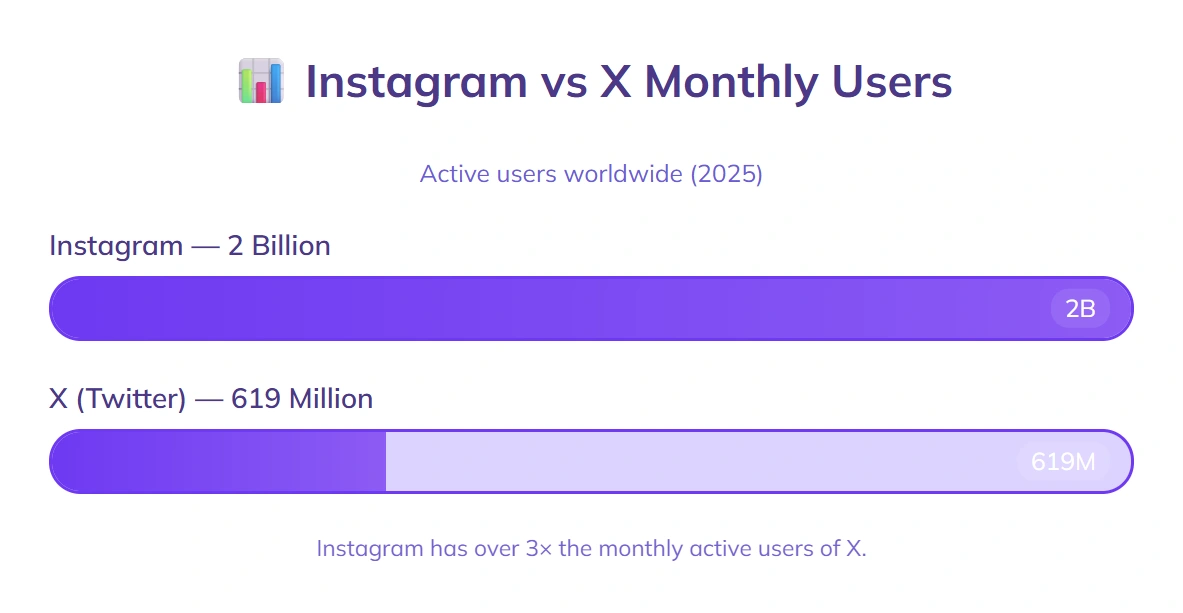
Photo posts on Instagram receive 25% more engagement than similar posts on Facebook.
Instagram ROI & Conversion Rates
Businesses report an average ROI of 420% from Instagram ad campaigns.
Instagram has a conversion rate of 1.6%, compared to Facebook’s 1.1%.
Product pages visited from Instagram generate 18% higher average order values than other social platforms.
73% of marketers say Instagram delivers the highest ROI among all social media channels.
Instagram Stories ads have a swipe-up conversion rate of 0.7%, while feed ads convert at 1.4%.
45% of Instagram users make a purchase after seeing a product in their feed.
Businesses with over 10k followers see a 32% higher conversion rate on Instagram compared to those with fewer followers.
Instagram ad CPC averages $1.25, compared to TikTok’s $0.99 and LinkedIn’s $5.26.
54% of shoppers say they are more likely to buy from brands they follow on Instagram.
Carousel ads on Instagram have a 72% higher conversion rate than single-image ads.
What’s New for Instagram Marketing in 2026
Reels can now be up to 3 minutes long, giving marketers room for tutorials and storytelling formats that previously lived on YouTube.
Trial Reels let accounts test content on non-followers before a full release, effectively giving every marketer built-in A/B testing for short-form video.
Instagram launched Edits, its standalone video creation app, bringing native editing, captions, and effects into the Instagram ecosystem.
Short-form keeps compounding: Reels drive more than 140 billion plays per day across Instagram and Facebook combined.
Threads passed 300 million monthly active users, giving Instagram accounts a second, text-based distribution surface with native cross-posting.
AI moved into the ad stack: more than 1 million advertisers now use Meta’s generative AI ad tools to produce creative variations automatically.
Key Takeaways: What the Data Means for 2026
Reels are the acquisition engine; the feed is for retention. Reels out-engage every other format (2.05% vs the 1.42% average), reach 22% more accounts than Stories, and 68% of Reels recommendations go to people who don’t follow you. If growth is the goal, Reels carry it.
Small accounts have a structural advantage. Accounts under 10,000 followers average 3.8% engagement versus 1.1% for accounts over 1 million, and micro-influencers out-engage macro-influencers by 41%. Buying relevance beats buying reach.
Consistency has an optimum, not a maximum. Four to seven posts per week is the sweet spot: posting more than 7 times weekly drops per-post engagement by 14%, while a 7-day silence costs 15% of reach. Sustainable cadence wins, which is why teams increasingly automate production.
Frequently Asked Questions
How many users does Instagram have in 2026?
Instagram has 2 billion monthly active users. India is the largest market with over 350 million users, and 72% of users open the app every day, spending an average of 33 minutes.
What is a good engagement rate on Instagram?
The average engagement rate is 1.42%, so anything above 2% is strong for most brands. Context matters: accounts under 10,000 followers average 3.8%, Reels average 2.05%, and large accounts over 1 million followers average just 1.1%.
When is the best time to post on Instagram?
Posts published between 6 PM and 8 PM see 12% higher engagement and 14% higher reach than morning posts. Early engagement matters too: interactions within the first 30 minutes can lift total reach by up to 20%.
How many people shop on Instagram?
32% of Instagram users made a purchase directly in the app within the past month, and 45% have bought a product after seeing it in their feed. Fashion leads with 23% of all Instagram purchases, followed by beauty at 16%.
The Bottom Line
Getting results on Instagram is easier when you understand how people use it.
The stats you’ve just read paint a clear picture of what grabs attention, what sparks interaction, and what encourages people to follow or buy.
Some of them might match what you’ve noticed in your own feed, while others might surprise you and open up new ideas. Keep these insights close as you plan your content, test new approaches, and try fresh ideas.
The more you know about your audience’s habits, the better your chances of creating posts that feel natural to them and stand out in a busy feed.

A seasoned entrepreneur and AI enthusiast, Michael frequently shares insights on the intersection of technology and marketing. His writing focuses on leveraging artificial intelligence to enhance marketing strategies.
Create videos 10x faster and easier with Zebracat
Try it now


Comments