

Table Of Content

Influencer marketing has become one of the most talked-about ways to reach people, and for good reason.
From Instagram stories that feel like a peek into someone’s daily life to YouTube videos that spark real conversations, influencers have a unique way of connecting with audiences that traditional ads often can’t match.
In 2026, brands aren’t just experimenting with this approach anymore; they’re making it a key part of their marketing plans.
But with so many platforms, creators, and trends to keep track of, it’s easy to feel overwhelmed. That’s where having solid, up-to-date numbers makes all the difference.
This list of 150+ influencer marketing statistics gives you a clear picture of what’s happening right now so you can focus on what works, skip what doesn’t, and build campaigns that get people’s attention.
Update (June 2026): We refreshed this article for 2026, harmonized the data, and added an FAQ answering the most-searched influencer marketing questions.
Create videos from text in 1 minute!
Make videos fast and save hours of work

Influencer Marketing Industry Growth
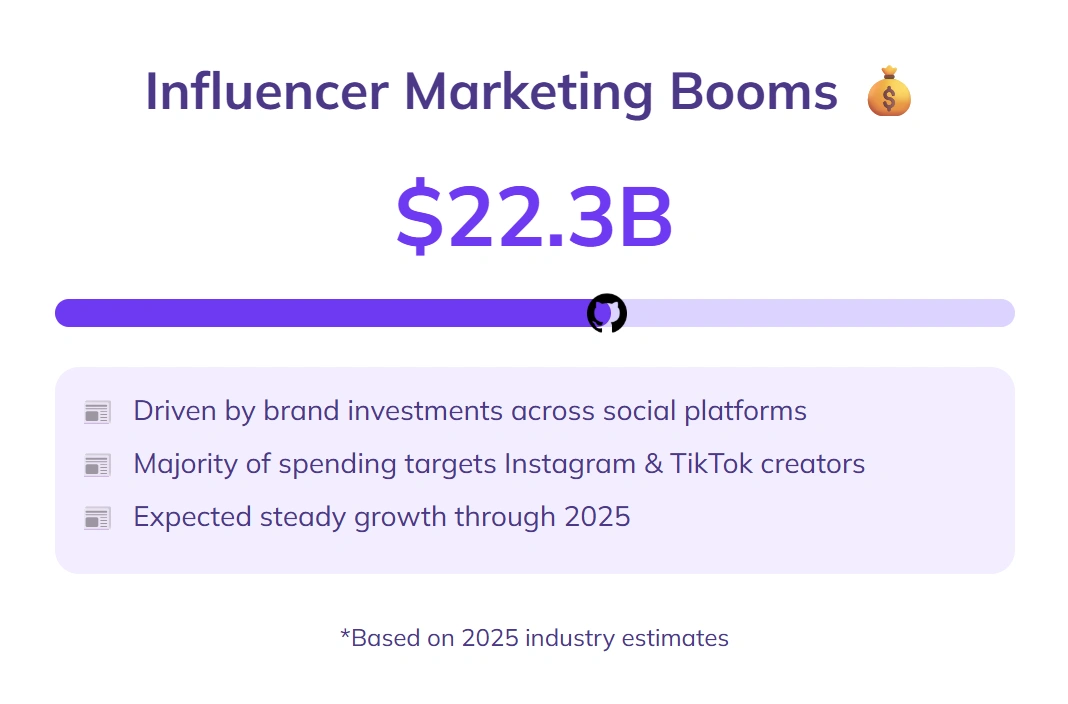
The influencer marketing industry is valued at $22.3 billion in 2025, with continued double-digit growth expected through 2026 as brand investment shifts further toward creators.
64% of brands increased their influencer marketing budgets compared to last year.
Micro-influencers make up 53% of all paid influencer collaborations in 2025.
72% of marketers say influencer campaigns deliver higher engagement rates than traditional digital ads.
The average ROI for every $1 spent on influencer marketing is $5.78.
Over 39% of brands run influencer campaigns every month.
Sponsored content posts on Instagram grew by 21% year-over-year.
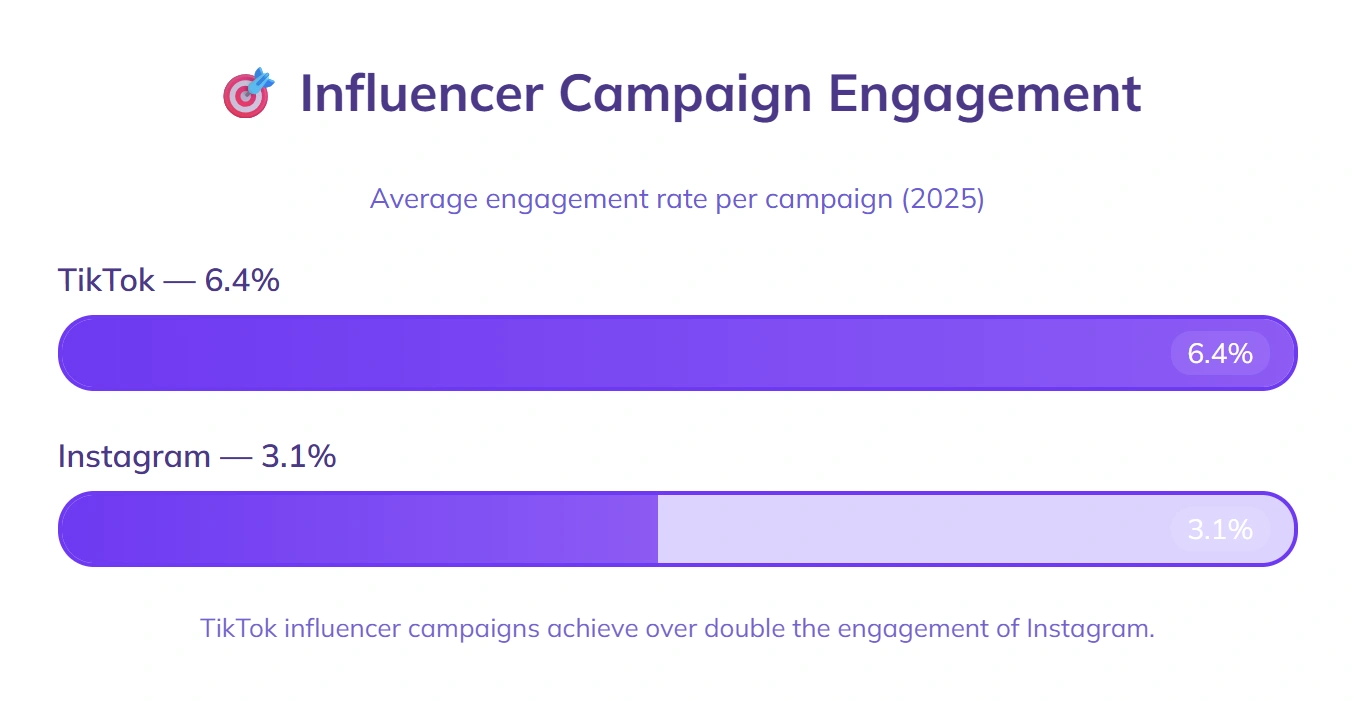
TikTok influencer campaigns generate an average engagement rate of 6.4%, compared to 3.1% on Instagram.
48% of brands now work with a mix of both paid and product-exchange influencer partnerships.
Long-term influencer contracts increased by 28% compared to short-term one-off deals.
Brands using influencer marketing are 2.3 times more likely to meet their campaign goals than those relying only on traditional ads.
AI TikTok VideoGenerator
Grow your audience and drive conversions on TikTok
Influencer Marketing & AI-Powered Video Tools
Nearly 42% of brands using text-to-video tools report faster turnaround in influencer content campaigns compared to traditional editing.
About 36% of influencers rely on AI avatar generators to create consistent branded content without the need for physical shoots.
Over 48% of creators experimenting with AI voice cloning say it helps them maintain authenticity across multilingual campaigns.
Over 55% of influencer agencies adopt automated video editing tools to scale short-form campaigns for TikTok and Instagram.
Roughly 46% of marketers say creating a marketing video with AI increases influencer engagement by making campaigns more interactive.
About 38% of influencer-led YouTube Shorts in 2025 were produced using text-to-video AI tools.
Nearly 50% of creators adding subtitles to their influencer campaigns use auto subtitle generators to improve accessibility and reach.
More than 44% of influencer campaigns on TikTok in 2024 incorporated AI-powered video generators for faster scaling.
Social Media Platform-Specific Stats
Instagram remains the most popular platform for influencer campaigns, used by 81% of brands.
34% of total influencer campaign views across platforms come from TikTok short-form content.
YouTube influencer videos have an average watch time of 5 minutes and 42 seconds per viewer.
54% of TikTok influencer campaigns feature short-form videos under 30 seconds.
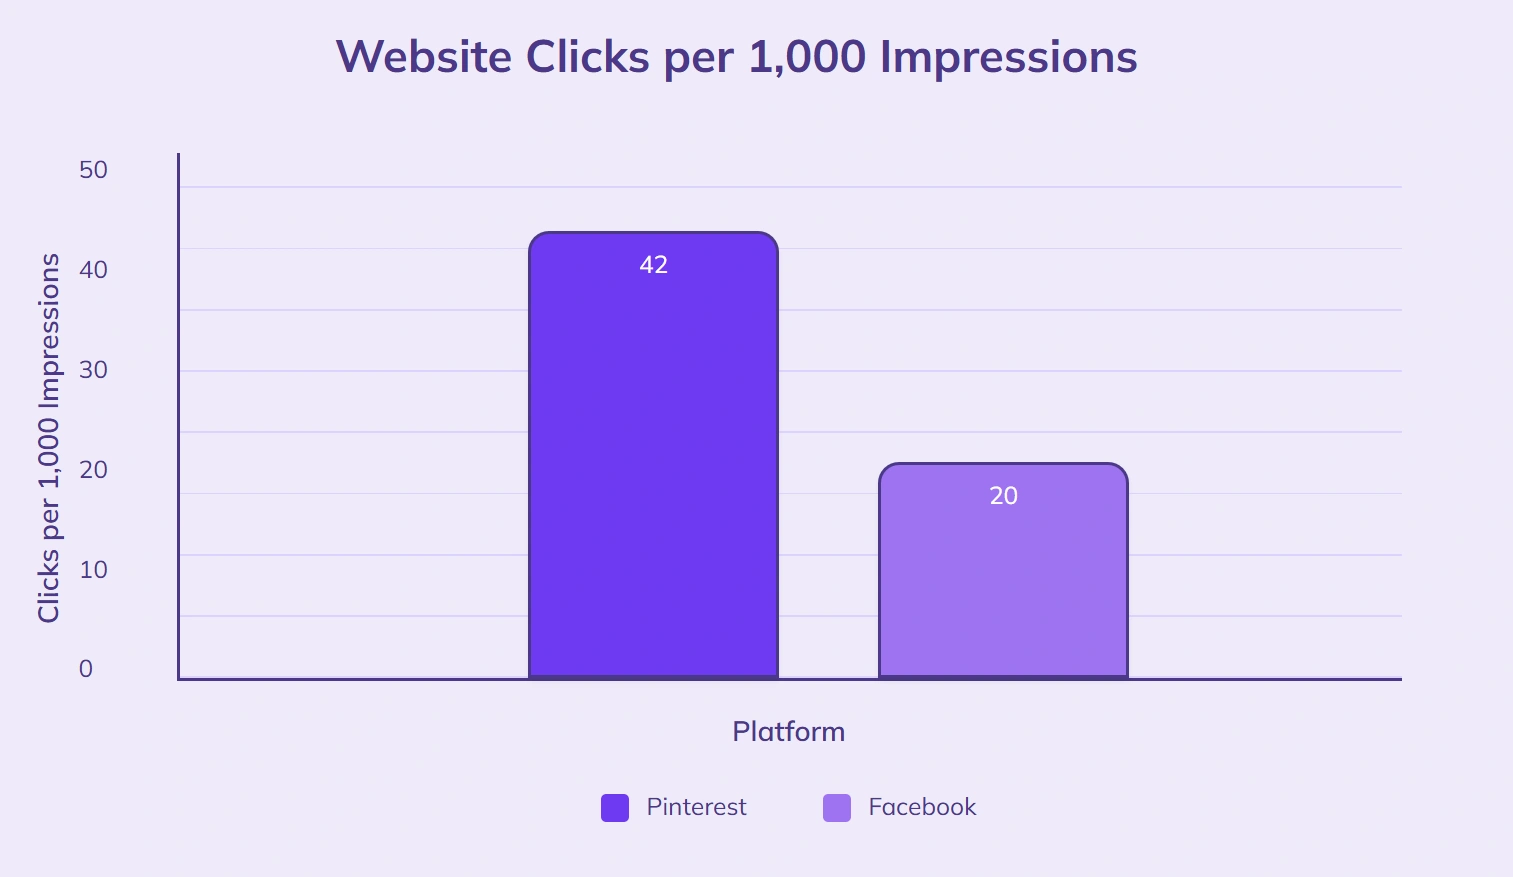
Pinterest influencer collaborations drive 42 website clicks per 1,000 impressions, compared with Facebook’s 20 clicks per 1,000 impressions.
LinkedIn influencer posts generate an average of 142 comments per campaign in B2B niches.
Facebook is used by 47% of brands for community-focused influencer campaigns.
Twitch influencer streams average 1,930 live viewers per sponsored broadcast.
Snapchat influencer content sees an average view completion rate of 67%.
TikTok influencer campaigns surpass 1 million views in 1.8% of campaigns, while Instagram Reels reach that milestone in 1.0% of campaigns.
The average tap-through rate for Instagram Stories with interactive stickers is 4.8%.
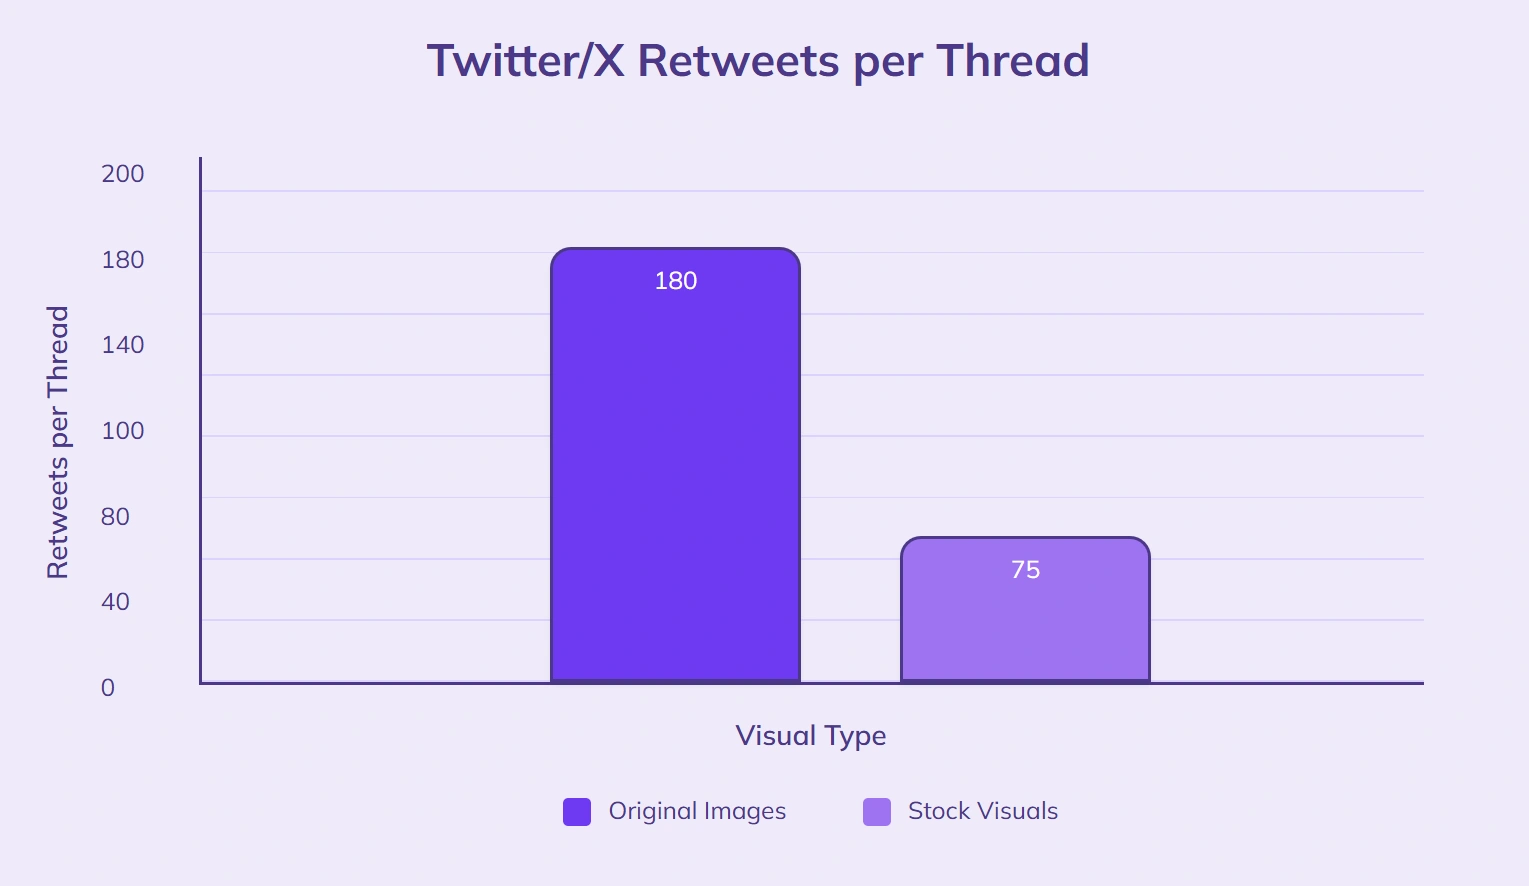
Twitter/X influencer threads with original images average 180 retweets per thread, compared with 75 retweets when using stock visuals.
Influencer Demographics
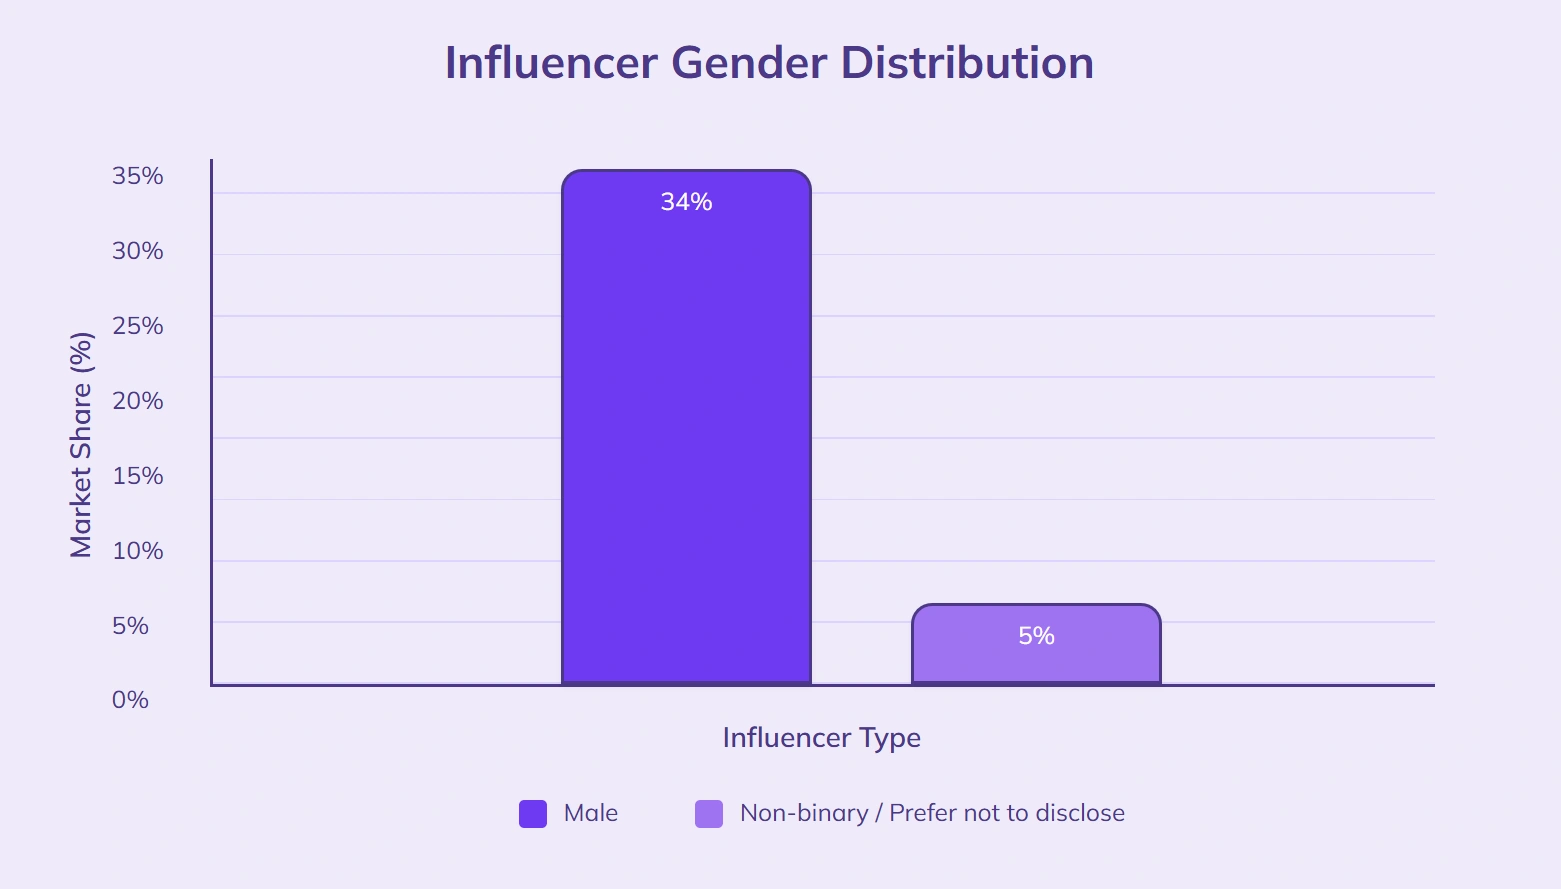
61% of active influencers in 2025 identify as female.
Male influencers account for 34% of the market, while 5% identify as non-binary or prefer not to disclose.
46% of influencers are between the ages of 25 and 34.
Gen Z influencers (ages 18–24) represent 29% of the influencer population.
Influencers aged 35–44 have an average audience size of 198,000, compared with 142,000 for those aged 25–34.
57% of influencers are based in urban areas, with 43% in suburban or rural locations.
Travel influencers have a global audience distribution of 64% international and 36% domestic followers.
Parenting influencers are 2.4 times more likely to have an audience that is 80% female than lifestyle influencers, whose audiences average 33% male.
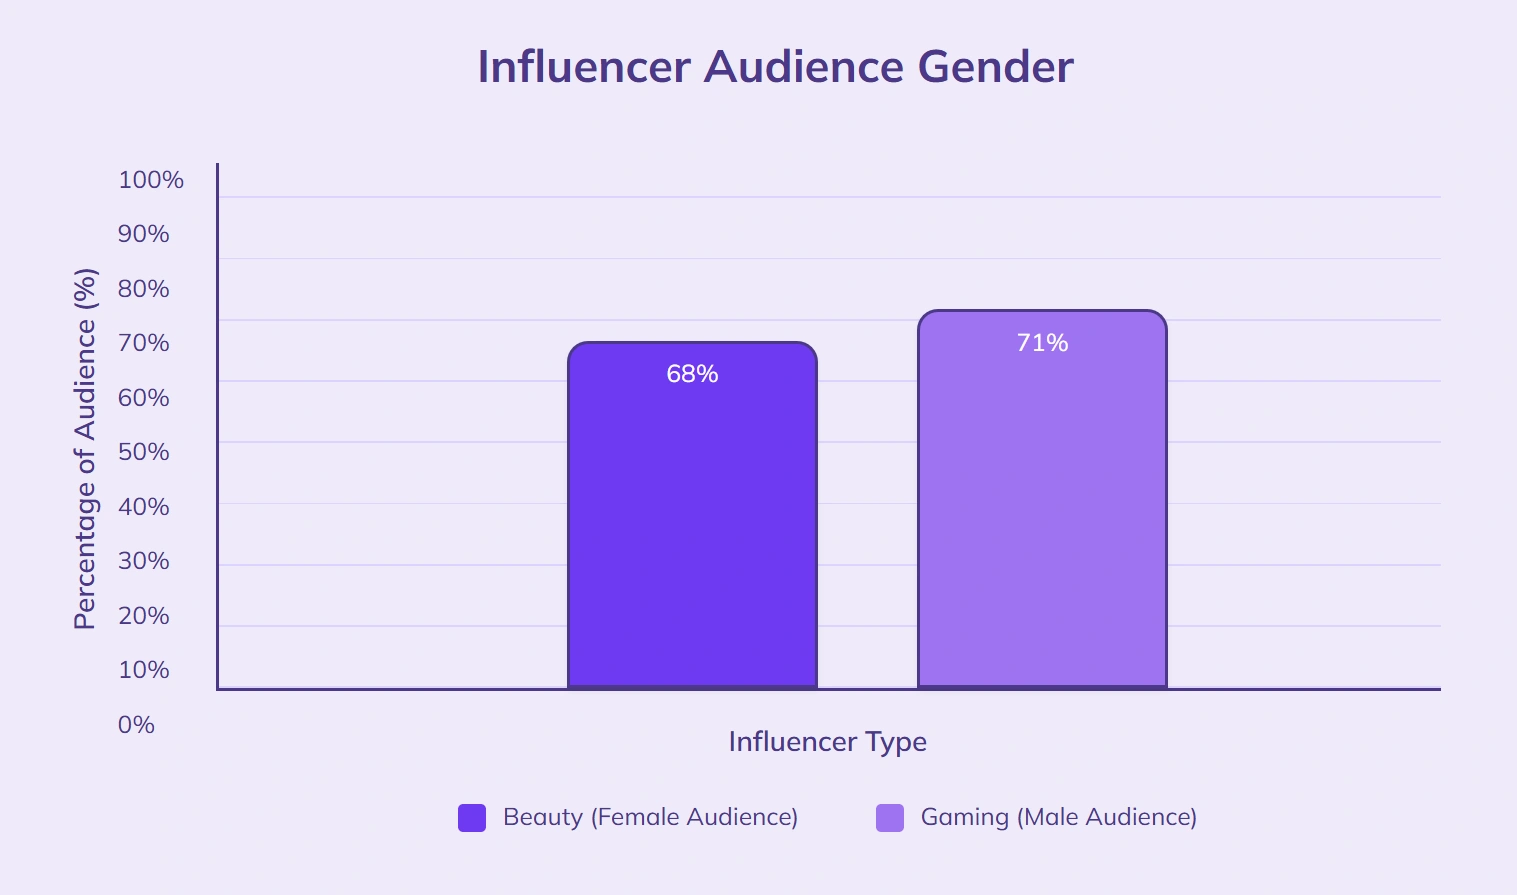
Beauty influencers average 68% female followers, while gaming influencers average 71% male followers.
38% of influencers speak more than one language on their platforms.
Food influencers have a median audience age of 31, compared with 27 for fitness influencers.
41% of influencers identify as part of a minority ethnic group.
Faceless Influencer Marketing: Key Numbers & Trends
Faceless creator networks have grown from 5,000 to 21,000 creators in just three months, showing explosive demand.
Top-performing faceless creators are earning between $30,000 and $40,000 per month through brand collaborations.
Faceless videos outperform traditional influencer videos, averaging a 46% engagement rate compared to 32% when the influencer is visible. They also generate more views, with an average of 6 million views vs. 1.6 million.
On TikTok, content with the hashtag #faceless has already surpassed 1.1 billion views.
Brands are using faceless content because it is often more budget-friendly, scalable, and less risky than personality-driven campaigns. It also allows creators to run multiple accounts using AI tools, producing large amounts of content quickly.
Create engaging faceless social videos with AI
Turn your ideas into scroll stopping videos with no camera needed
Consumer Behavior & Trust
71% of consumers say they trust influencer recommendations as much as recommendations from friends or family.
58% of shoppers have purchased a product in the past 12 months based solely on an influencer’s endorsement.
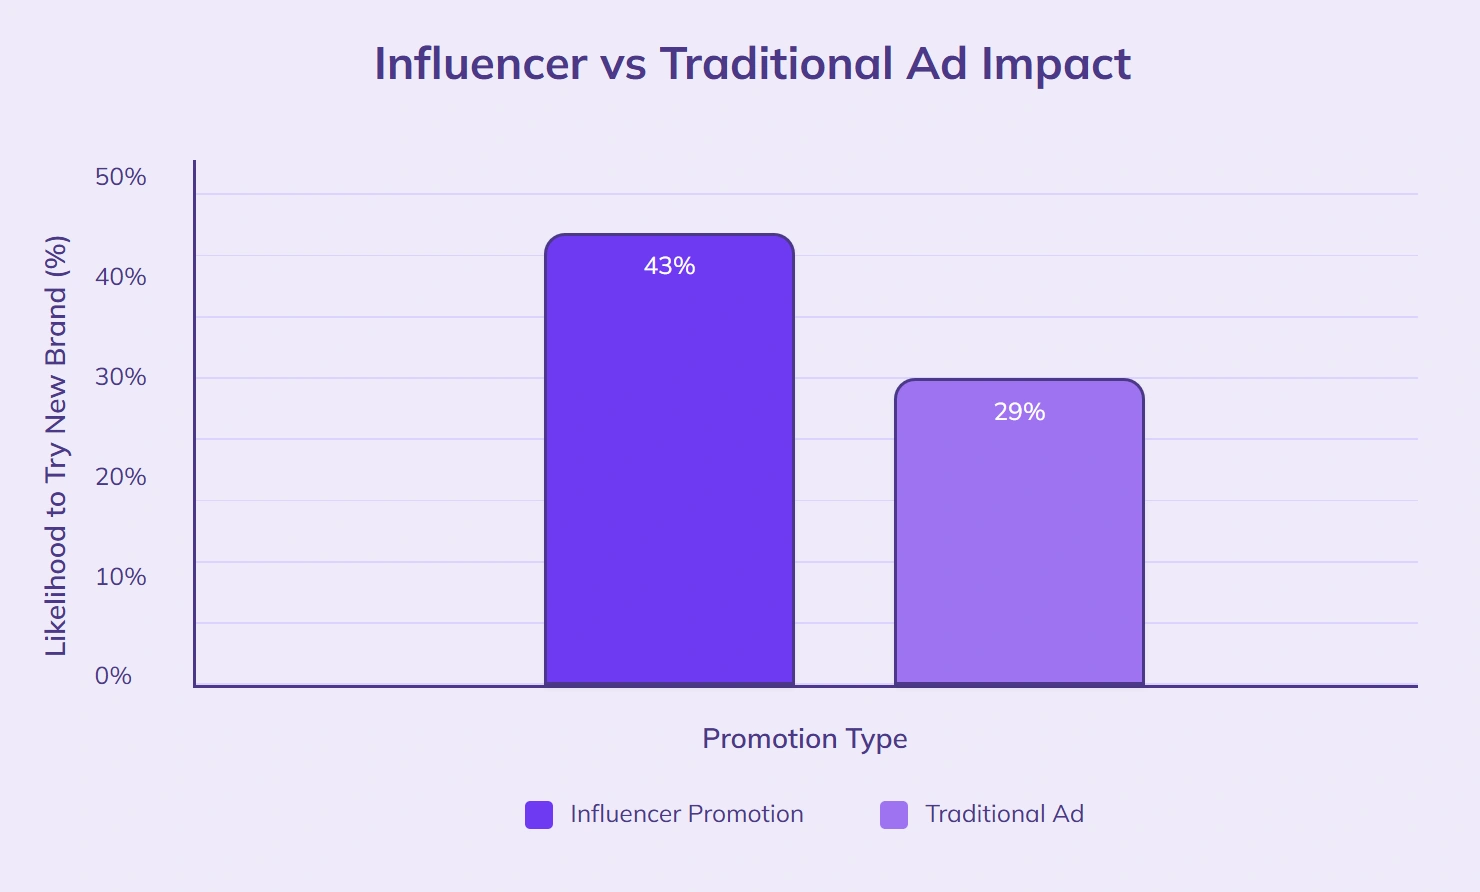
43% of consumers are more likely to try a new brand if it’s promoted by an influencer they follow, compared with 29% when seeing it in a traditional ad.
36% of consumers follow at least one influencer primarily for product reviews.
Product tutorials from influencers have an average watch completion rate of 82%.
49% of consumers say they’ve discovered a new product category through influencer content.
27% of followers have unfollowed an influencer after feeling misled by sponsored content.
65% of consumers trust influencers more when they disclose sponsorships, compared with 38% when they do not.
Influencer-led campaigns increase purchase intent by 21% compared to campaigns without influencer involvement.
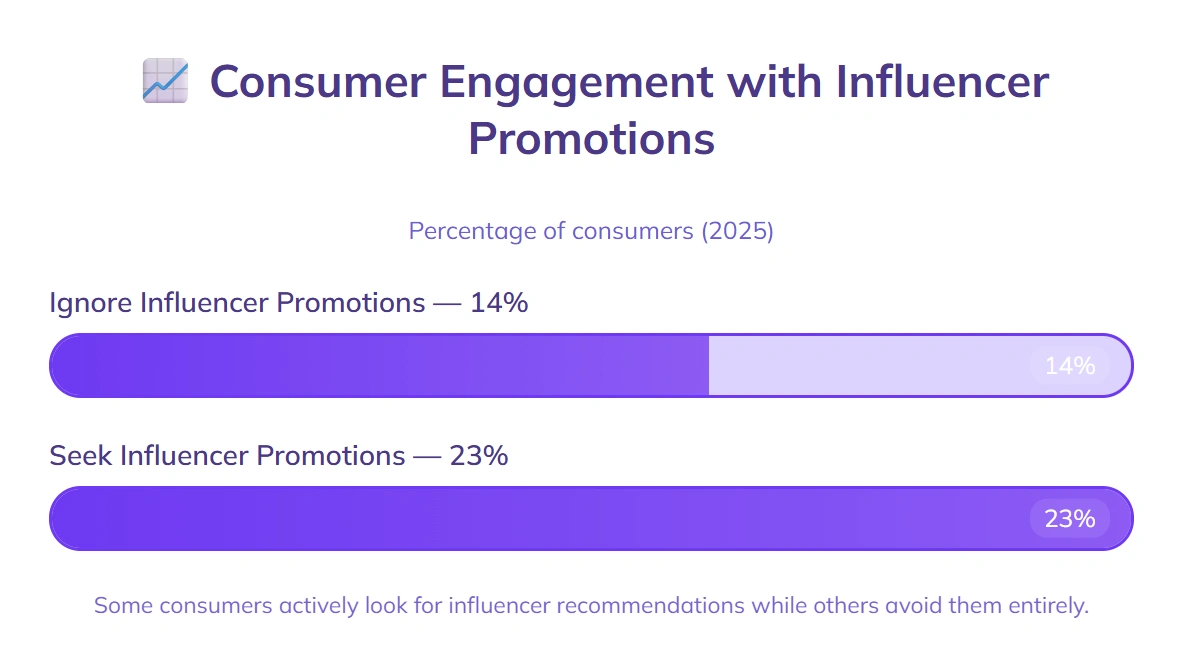
14% of consumers say they ignore influencer promotions entirely, while 23% actively seek them out for purchase ideas.
52% of consumers engage with influencer content weekly, with 19% engaging daily.
Video testimonials from influencers drive 2.3 times more click-throughs than static image endorsements, with an average CTR of 3.4% vs. 1.5%.
ROI & Conversion Rates
Businesses earn an average of $5.78 for every $1 spent on influencer marketing.
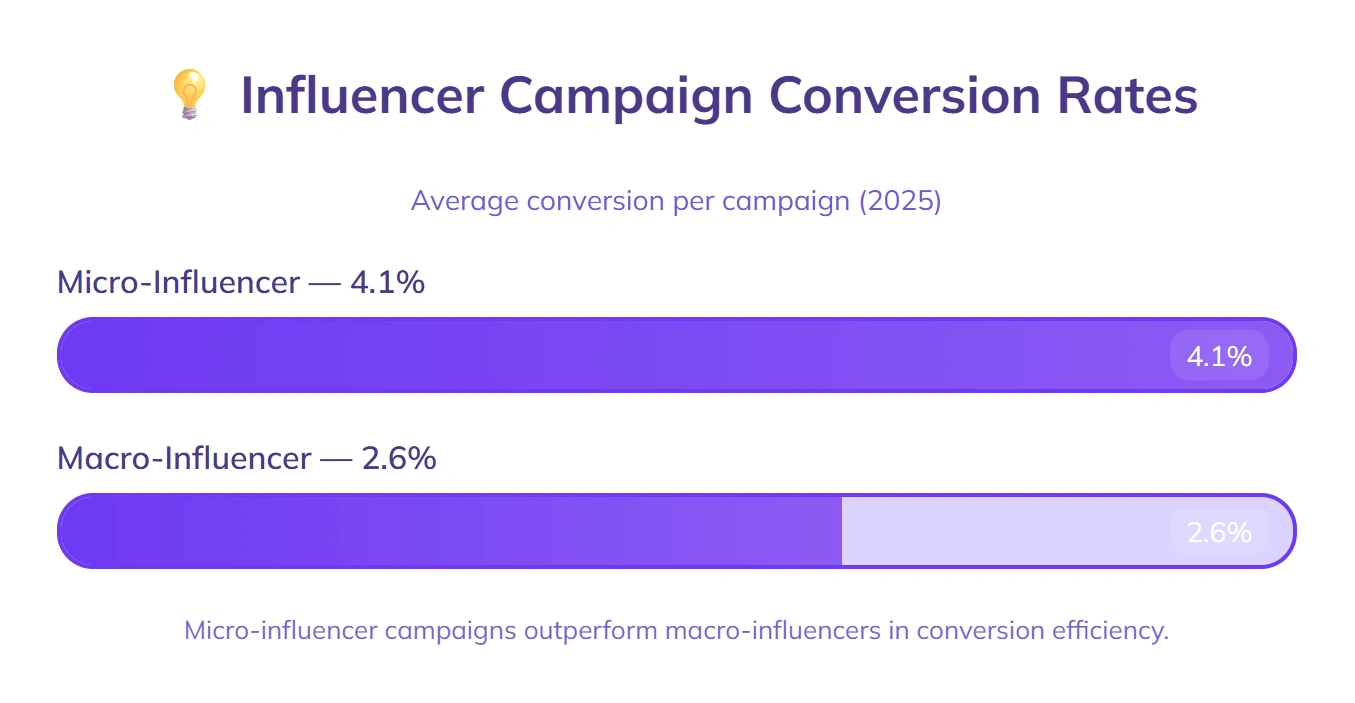
Micro-influencer campaigns achieve conversion rates of 4.1%, compared with 2.6% for macro-influencer campaigns.
Campaigns with a clear call-to-action in influencer captions see a 22% higher conversion rate than those without one.
Affiliate links shared by influencers have an average click-through rate of 3.7%.
61% of brands say influencer content generates a higher ROI than traditional display ads.
Video-based influencer campaigns convert 38% better than image-only campaigns.
Instagram Stories with product tags drive an average of 8% swipe-up conversion.
Influencer discount codes result in 19% more first-time purchases compared to campaigns without them.
Campaigns on TikTok generate an average cost per acquisition of $1.67, compared with $2.14 on Instagram.
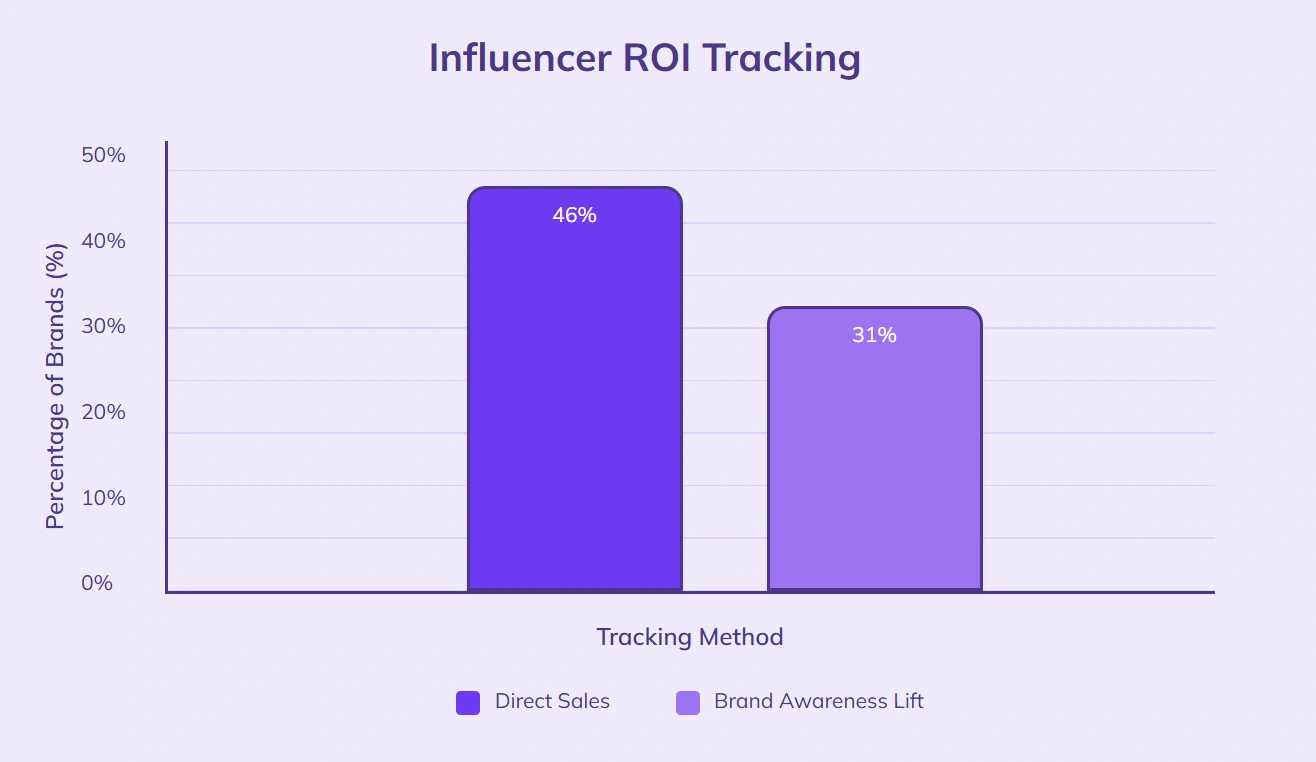
46% of brands track direct sales from influencer partnerships, while 31% measure ROI based on brand awareness lift.
Influencer-led email list growth campaigns have a sign-up conversion rate of 5.2%.
Campaigns that use multiple influencers in the same niche achieve 27% higher conversion rates than single-influencer campaigns.
Influencer Pricing & Payments
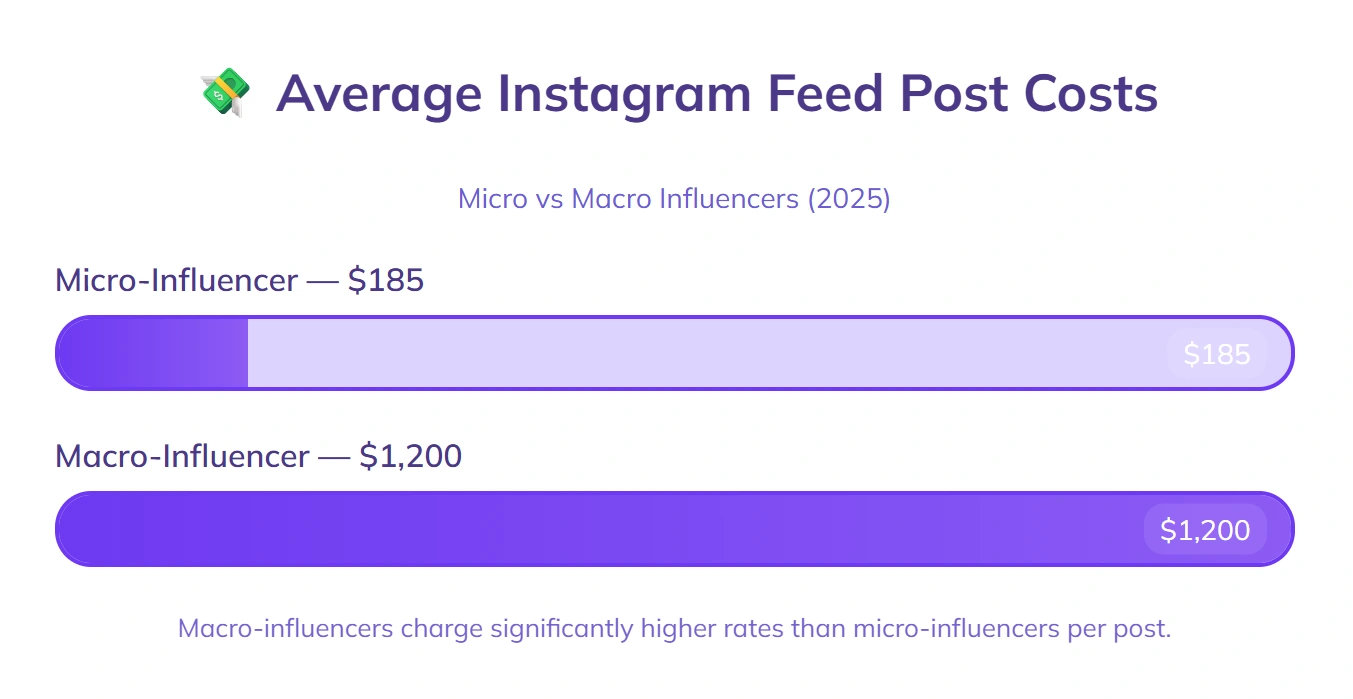
The average cost for a single Instagram feed post from a micro-influencer is $185, while macro-influencers average $1,200 per post.
Influencers on TikTok charge an average of $2.04 per 1,000 views, compared with $3.12 per 1,000 views on Instagram.
54% of brands pay influencers a flat fee per campaign, while 32% use a mix of flat fee and performance-based bonuses.
The median payment for a YouTube integration in 2025 is $1,050 for creators with under 100k subscribers.
Influencers offering full content packages (posts, reels, and stories) earn 37% more than those charging per post.
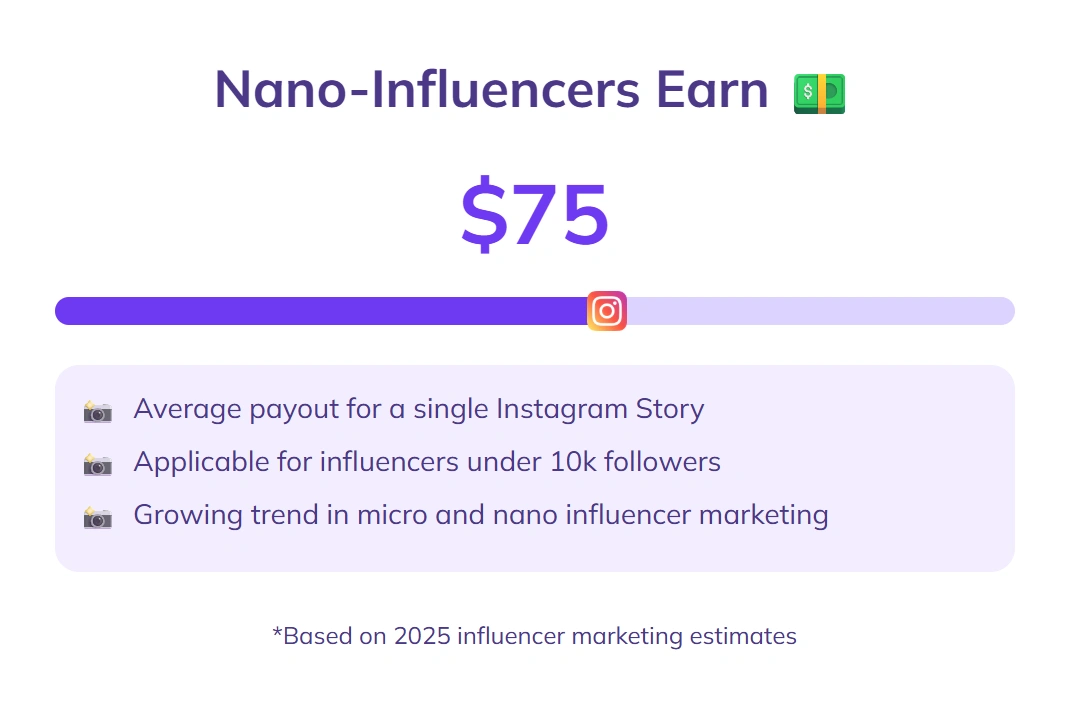
Nano-influencers (under 10k followers) receive an average of $75 for a single Instagram Story.
41% of influencers have increased their rates in the past year due to higher demand for short-form video content.
Travel influencers charge an average of $2,800 per sponsored trip, including deliverables.
Campaigns that pay influencers with a mix of cash and free products have 18% lower total costs compared to cash-only payments.
29% of influencers prefer to be paid through digital wallets instead of bank transfers.
Brand collaborations on Twitch average $0.55 per live viewer, compared with $0.34 per viewer on Facebook Live.
Seasonal campaigns (like holidays or Black Friday) see influencer rates increase by an average of 24% compared to off-season campaigns.
Campaign Types & Formats
Instagram Story takeovers generate 21% higher engagement than standard feed posts for the same influencer.
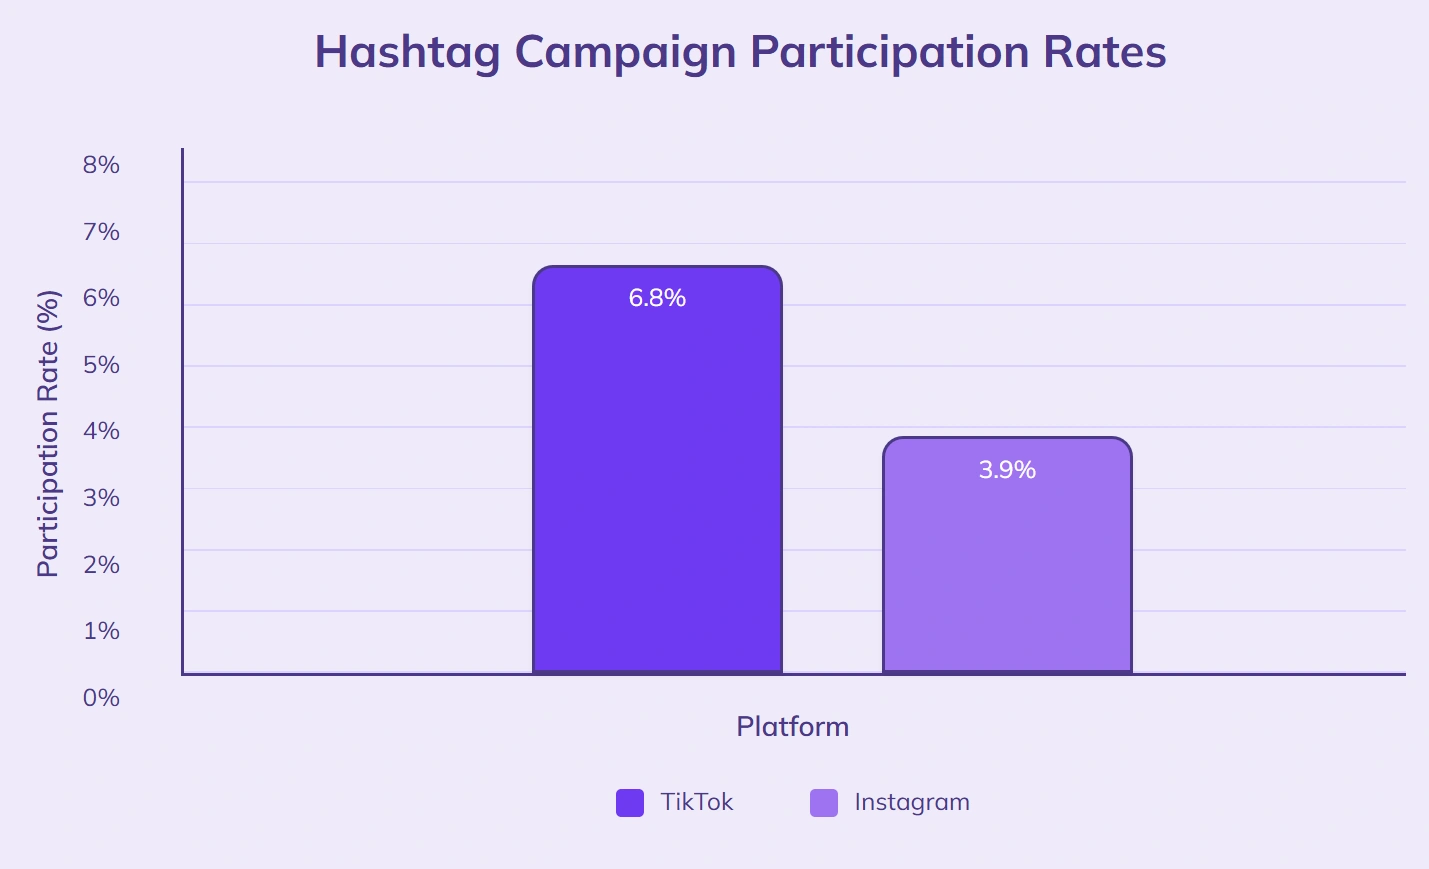
TikTok hashtag challenges average 6.8% participation rates, compared with 3.9% for Instagram hashtag campaigns.
47% of influencer campaigns in 2025 use a mix of short-form and long-form content to maximize reach.
Unboxing videos on YouTube have an average watch time of 5 minutes 12 seconds, making them one of the longest-viewed campaign formats.
Influencer-led giveaways drive 34% more follower growth compared to non-giveaway content.
Branded content in the form of Instagram Reels has a 2.1x higher share rate than static image posts.
39% of brands now run recurring monthly influencer collaborations instead of one-off campaigns.
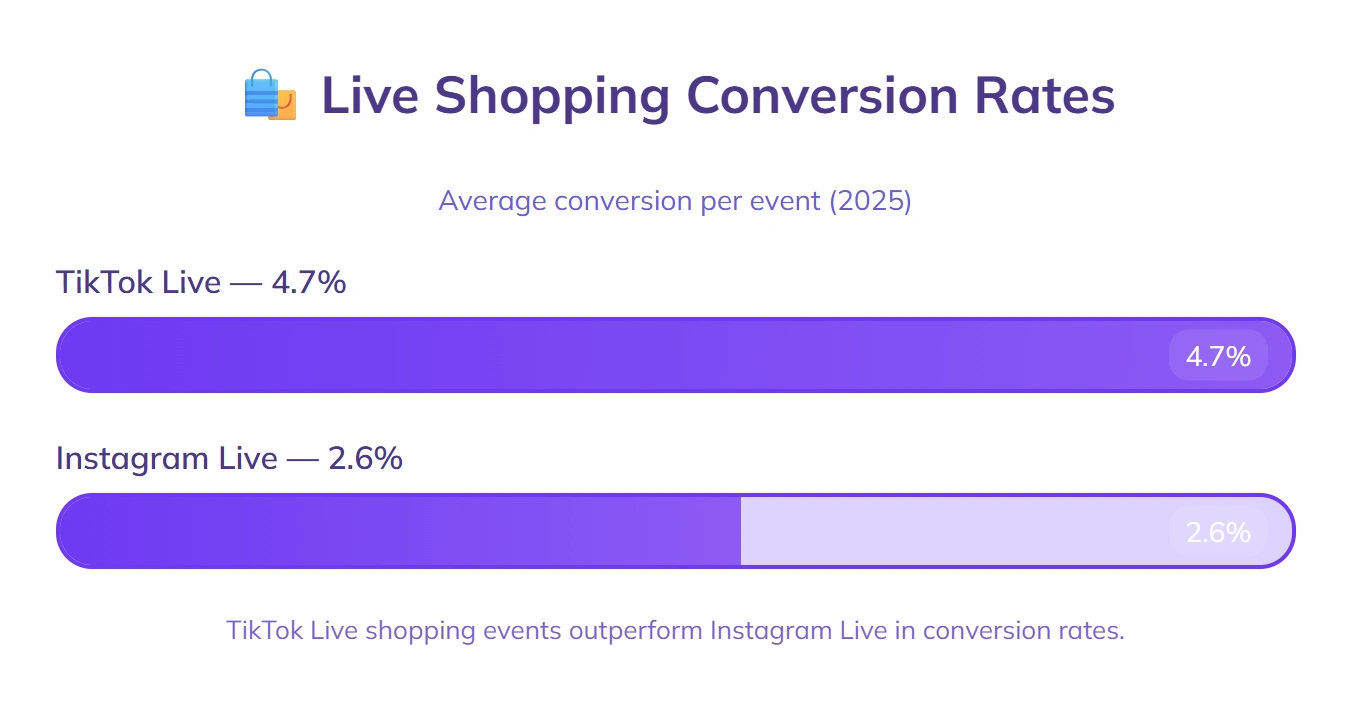
Live shopping events on TikTok convert at an average rate of 4.7%, compared with 2.6% on Instagram Live.
52% of campaigns that feature behind-the-scenes content report higher audience trust scores.
Sponsored podcast episodes have an average completion rate of 68%, compared to 52% for sponsored YouTube videos of similar length.
Seasonal-themed campaigns, like Ramadan or Christmas promotions, generate 23% higher click-through rates than evergreen campaigns.
44% of all influencer campaigns in 2025 include at least one user-generated content (UGC) repost in the brand’s feed.
AI Youtube Video Generator
Go viral quickly with high-quality videos
B2B vs B2C Influencer Marketing
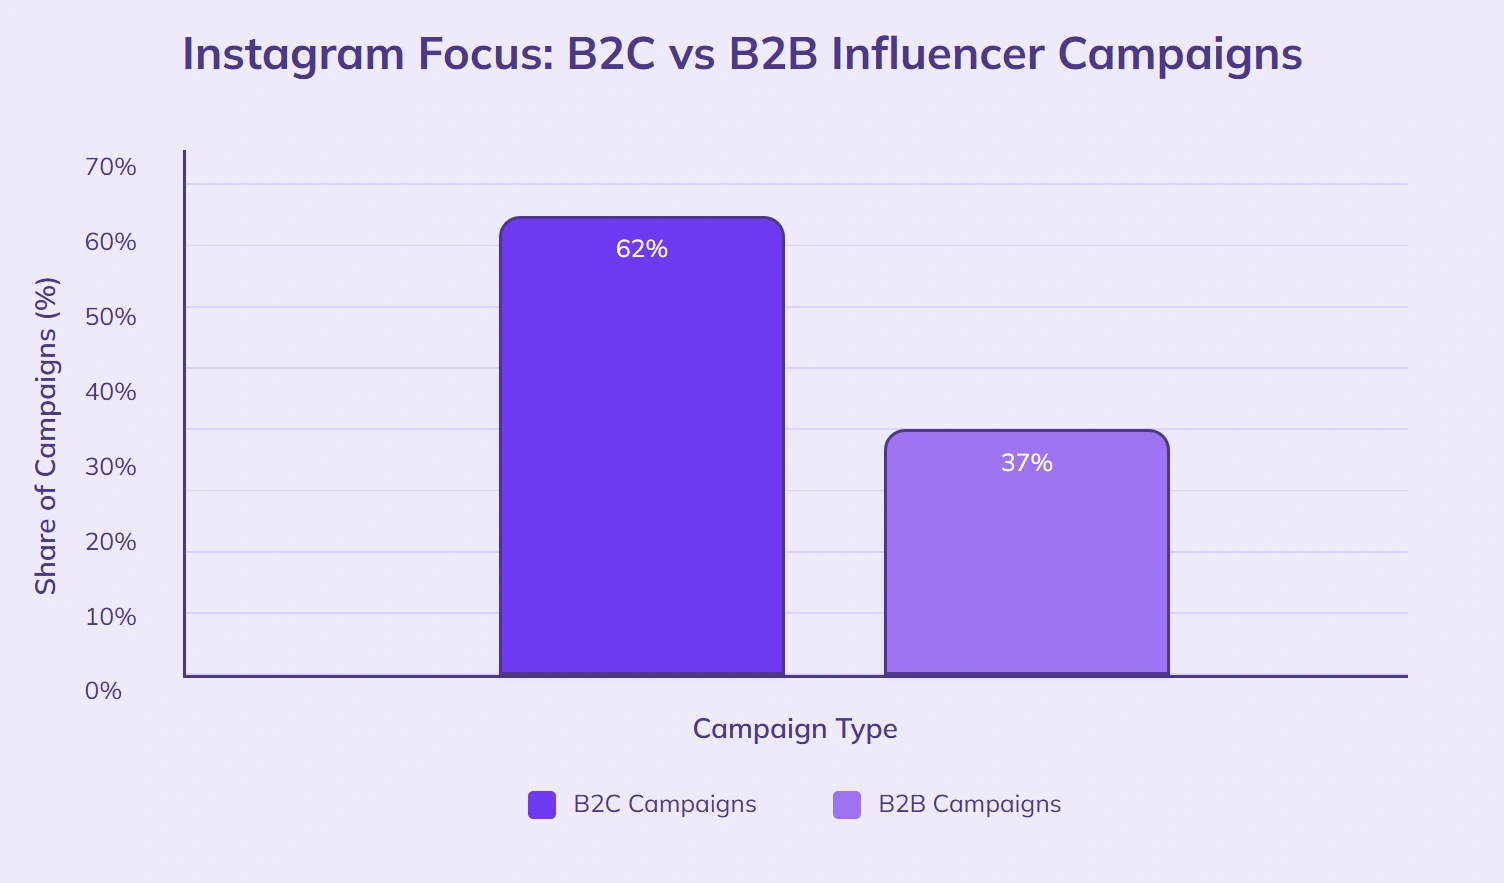
62% of B2C influencer campaigns focus on Instagram, while only 37% of B2B campaigns do the same.
B2B campaigns see an average lead conversion rate of 3.4%, compared to 1.9% for B2C when measuring qualified leads only.
41% of B2B influencer content is educational, while 54% of B2C content is entertainment-focused.
LinkedIn accounts for 71% of all B2B influencer activity in 2025.
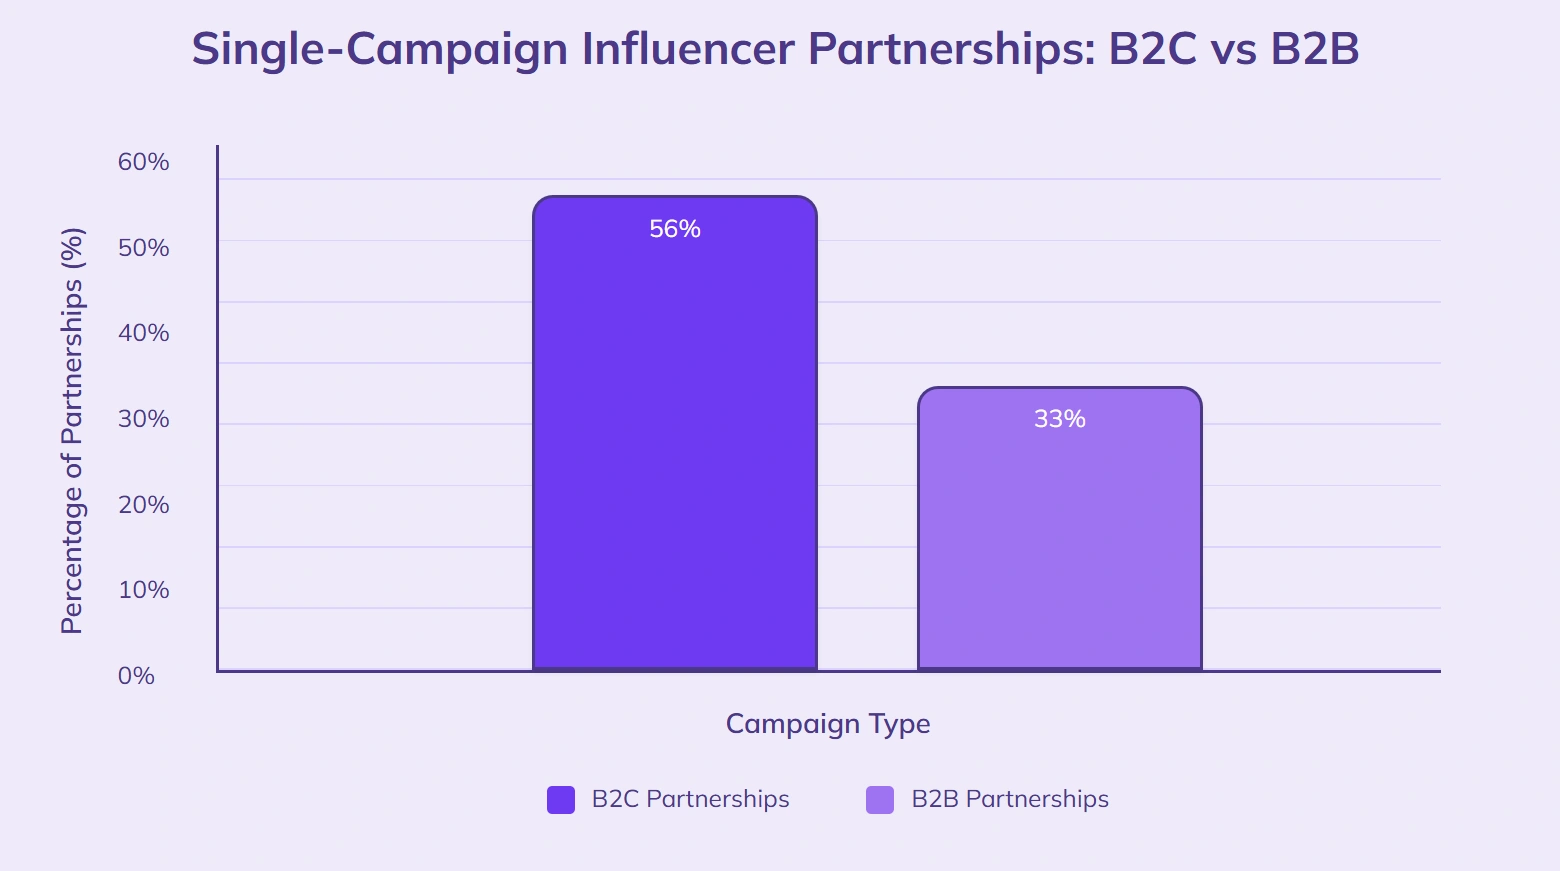
56% of B2C influencer partnerships last for a single campaign, versus 33% in B2B, where long-term deals are more common.
Average deal size from B2B influencer campaigns is $12,400, compared to $1,870 for B2C.
48% of B2C influencer collaborations include discount codes, compared with 19% in B2B.
Webinars hosted by B2B influencers average 812 live attendees, while B2C live streams average 1,450 viewers.
29% of B2B brands integrate influencers into their account-based marketing (ABM) strategies.
In B2C, product review videos generate 27% more engagement than lifestyle posts; in B2B, case study posts perform 19% better than product overviews.
63% of B2B influencer campaigns run for over 3 months, while 42% of B2C campaigns have the same duration.
Email sign-up campaigns led by B2B influencers convert at 4.1%, compared to 2.3% in B2C.
Micro vs Macro Influencer Stats
Micro-influencers (10K–50K followers) have an average engagement rate of 5.7%, while macro-influencers (500K+ followers) average 1.8%.
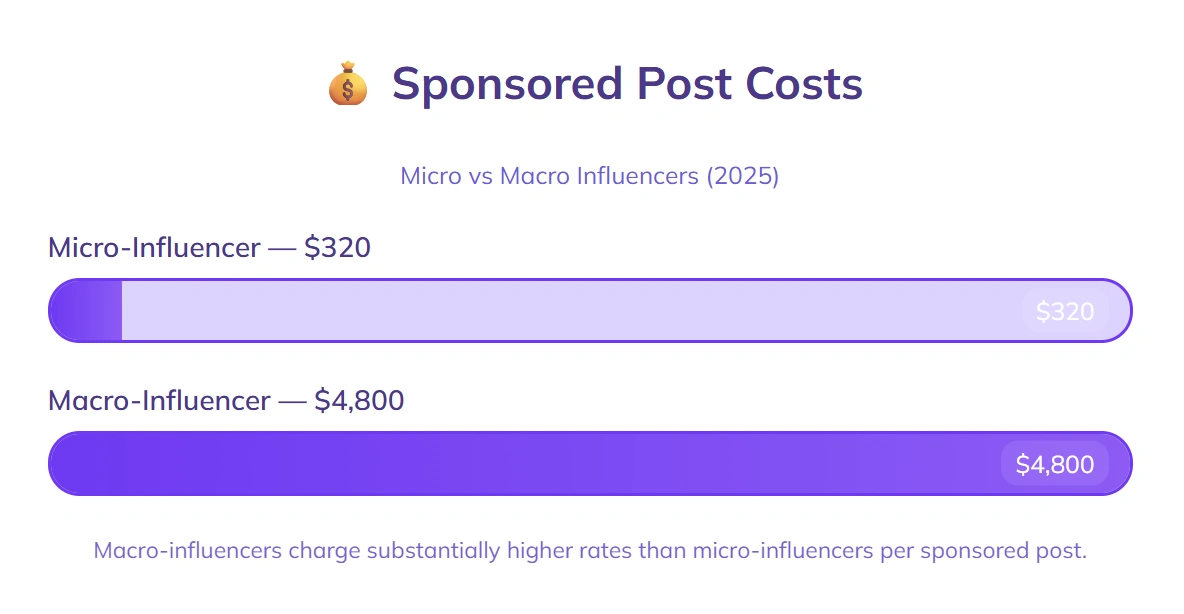
Sponsored posts from micro-influencers cost an average of $320, compared to $4,800 for macro-influencers.
Micro-influencer campaigns generate 22% more comments per post than macro-influencer campaigns of similar scope.
61% of brands report higher ROI from micro-influencers than macro-influencers.
Macro-influencer content reaches an average of 650,000 people per campaign, while micro-influencer campaigns average 48,000.
47% of micro-influencers collaborate with brands for free products, compared to 9% of macro-influencers.
Click-through rates (CTR) from micro-influencers average 2.4%, while macro-influencers average 1.1%.
39% of micro-influencer campaigns focus on niche audiences, compared with 14% for macro-influencers.
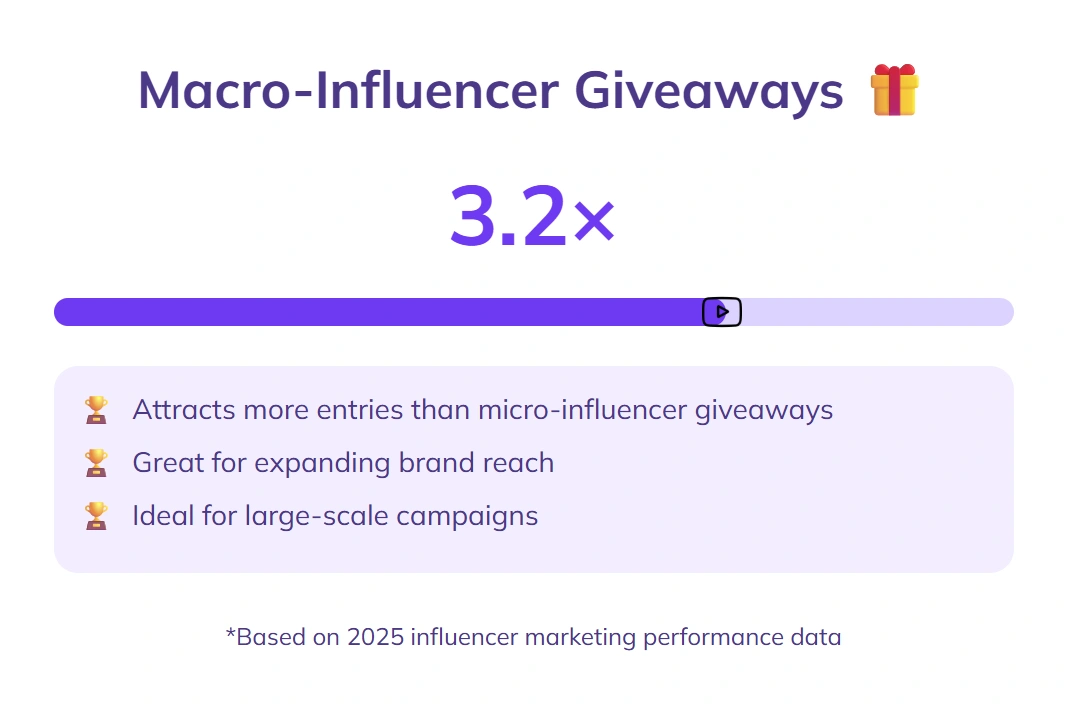
Macro-influencer giveaways attract 3.2× more entries than micro-influencer giveaways on average.
52% of micro-influencers post 4+ times a week, compared to 31% of macro-influencers.
68% of micro-influencers create their own visuals without brand input, versus 42% of macro-influencers.
Campaigns using micro-influencers see 28% higher repeat customer purchases than those using macro-influencers.
Regional & Global Trends
The Asia-Pacific region accounts for 39% of global influencer marketing spending in 2025.
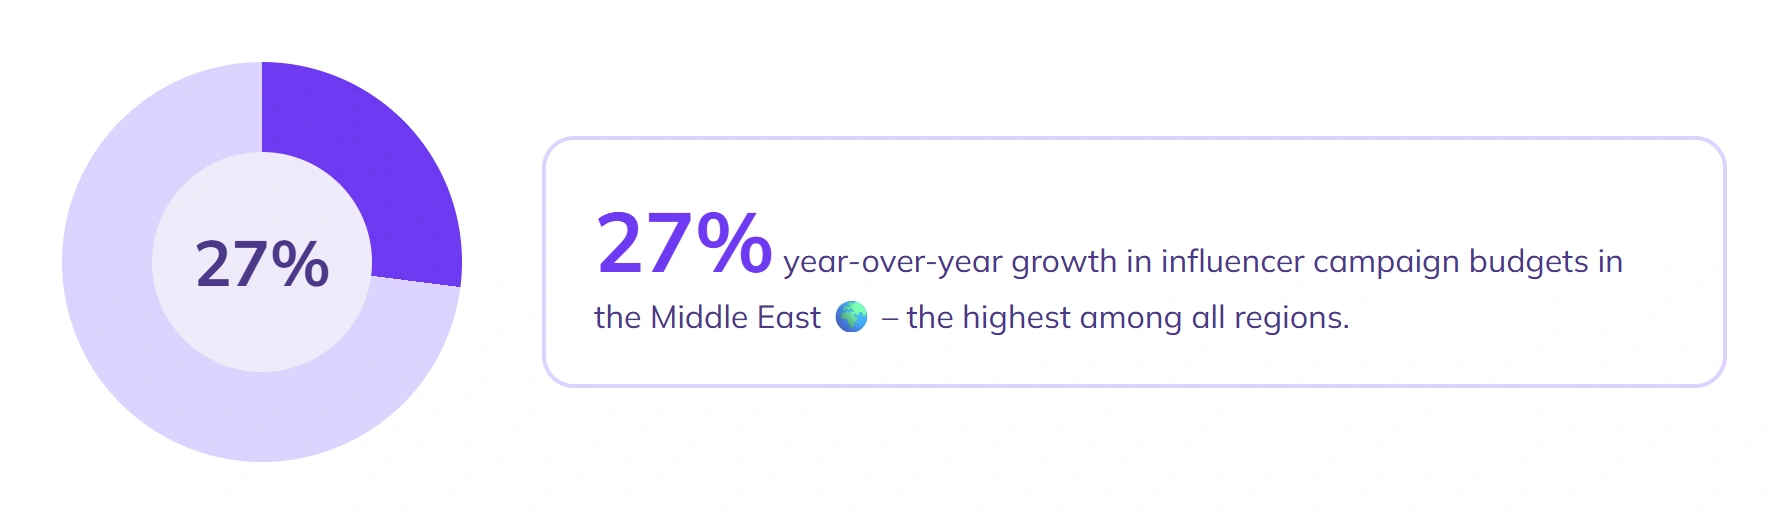
Influencer campaign budgets in the Middle East grew by 27% year-over-year, the highest among all regions.
European brands spend an average of €42,000 per influencer campaign, compared to $58,000 in North America.
54% of Latin American consumers have purchased a product in the past month because of an influencer recommendation.
Africa’s influencer market is projected to reach $2.3 billion by 2027, growing at 16% annually.
Engagement rates in Southeast Asia average 6.1%, while North America averages 3.4%.
The U.S. leads global TikTok influencer spending at $1.9 billion in 2025.
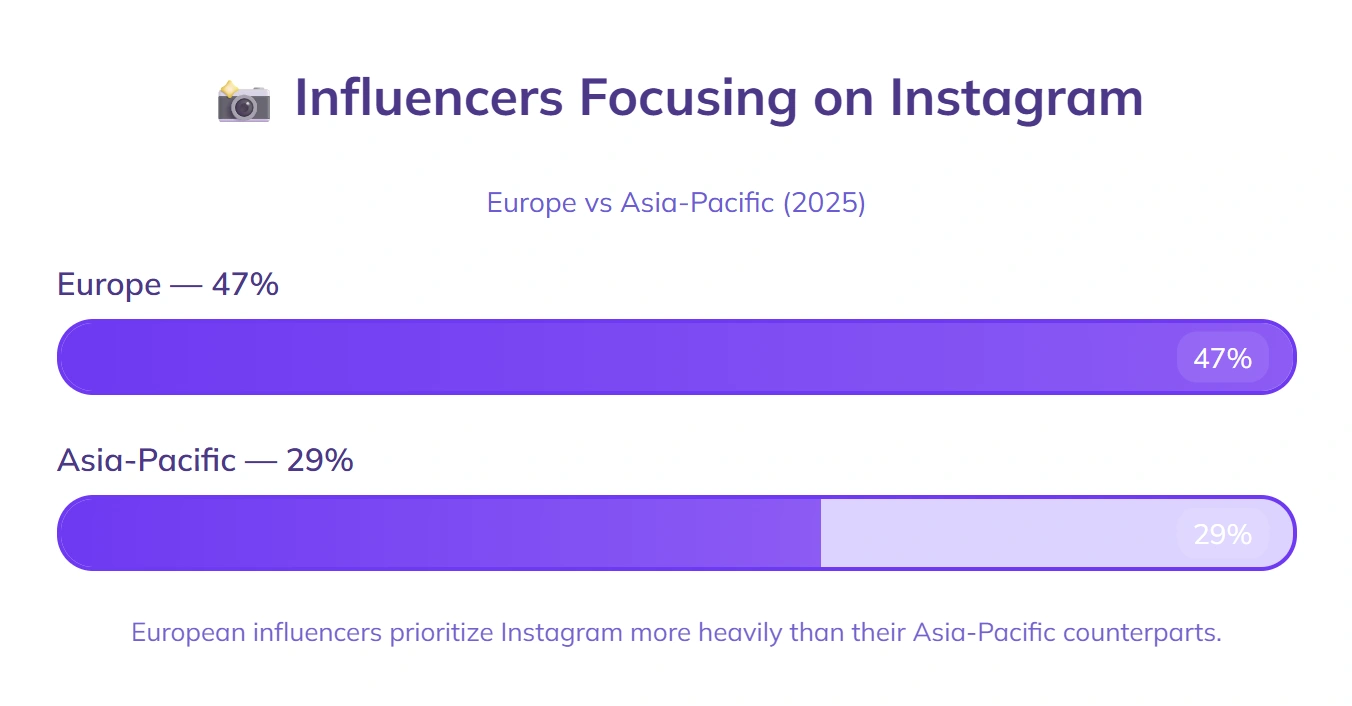
47% of European influencers focus primarily on Instagram, compared to 29% in Asia-Pacific.
Influencer campaigns in Japan have a conversion rate of 3.8%, while South Korea averages 5.2%.
Brands in the UAE allocate 19% of their total marketing budget to influencer campaigns, compared to 11% in the UK.
66% of Australian consumers follow at least one local influencer for product recommendations.
Cross-border influencer collaborations rose by 22% globally in the past year.
AI & Influencer Marketing Automation
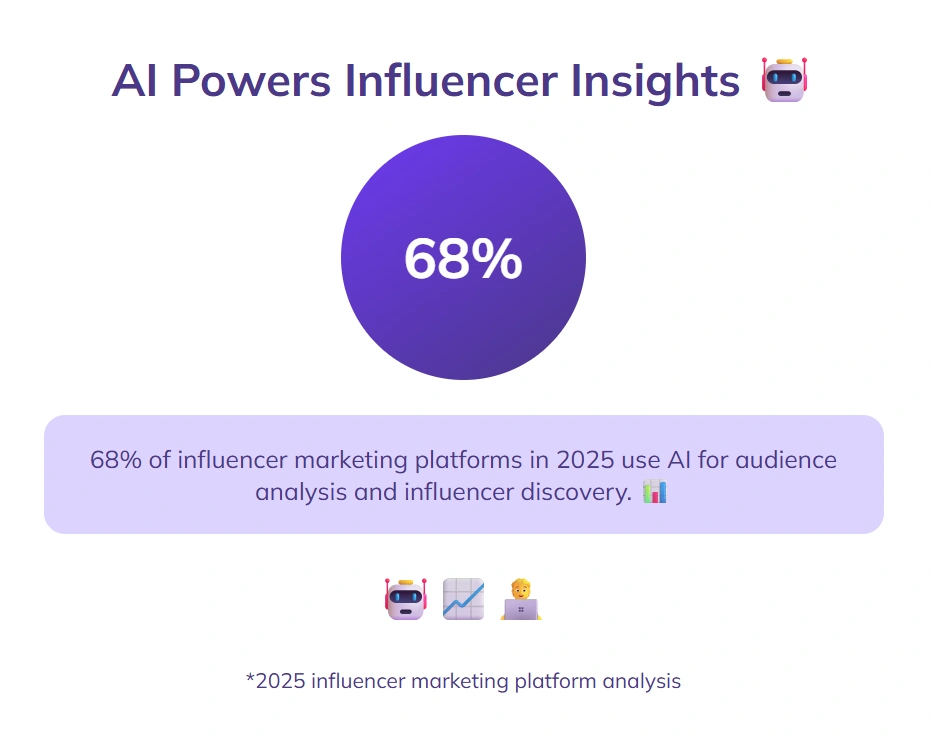
68% of influencer marketing platforms in 2025 use AI for audience analysis and influencer discovery.
AI-powered campaign optimization tools have increased ROI by an average of 21% across brands.
Brands using AI for influencer shortlisting spend 42% less time on campaign setup compared to manual selection.
57% of marketers say AI content analysis helps them detect fake followers more accurately.
Campaigns using AI-generated performance forecasts achieve 14% higher engagement rates on average.
38% of influencers use AI-assisted tools to edit images and videos for faster content turnaround.
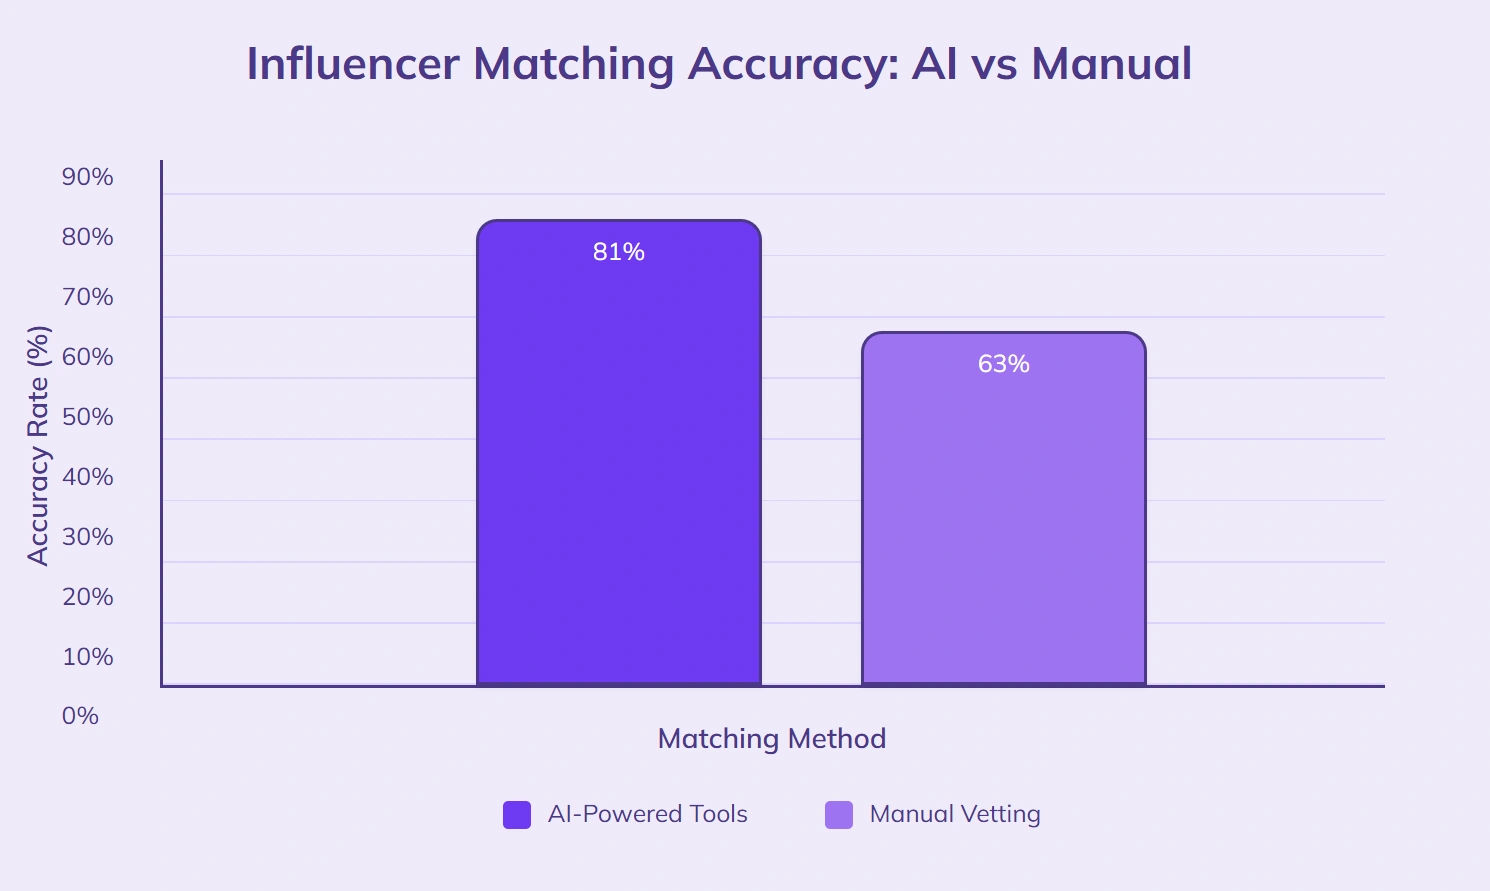
AI-powered influencer matching tools have an accuracy rate of 81%, compared to 63% for manual vetting.
Automated reporting through AI saves brands an average of 11 hours per campaign.
46% of brands using AI for content scheduling post an average of 5.2 times per week, compared to 3.4 times for non-AI users.
AI sentiment analysis tools identify audience mood shifts 2.5x faster than traditional survey-based methods.
29% of brands have experimented with fully AI-generated influencer personas in campaigns.
Predictive AI tools in influencer marketing reduce campaign budget waste by 17% on average.
Future Outlook & Predictions
48% of brands plan to increase influencer marketing budgets by 2030.
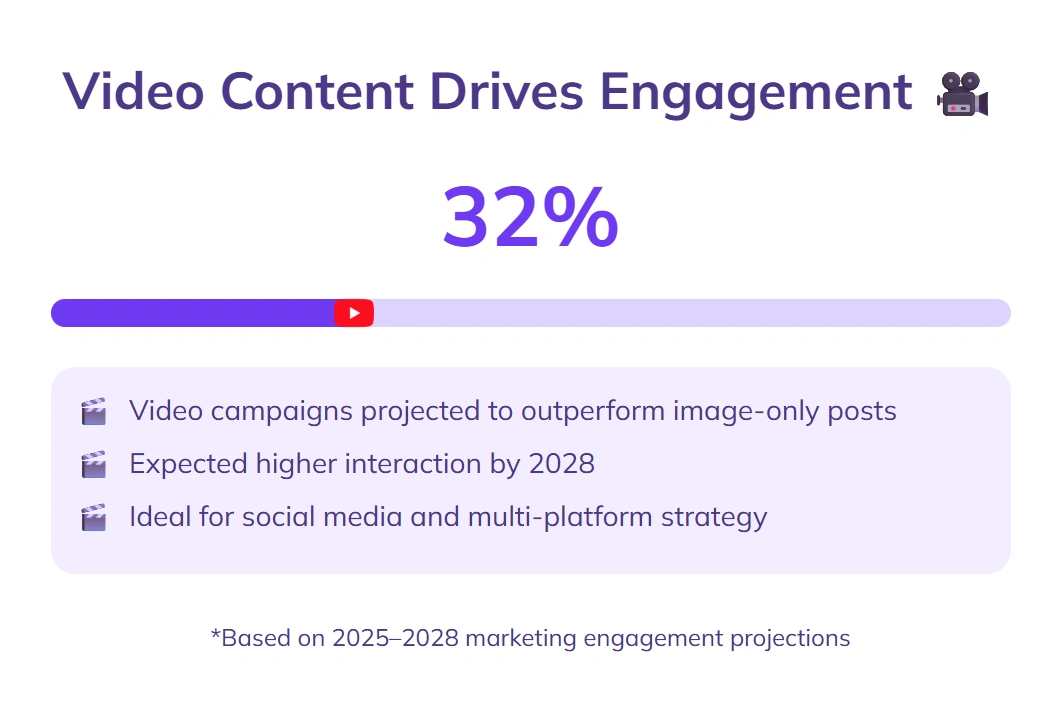
Campaigns integrating video content are projected to drive 32% more engagement by 2028 compared to image-only campaigns.
37% of marketers expect TikTok to contribute a larger share of influencer-driven sales than Instagram by 2027.
AI-powered influencer selection tools are anticipated to reduce campaign setup time by 39% by 2026.
26% of brands plan to focus more on micro-influencers with niche audiences than macro-influencers by 2029.
Cross-platform campaigns are expected to see a 21% higher conversion rate by 2027 than single-platform campaigns.
33% of brands foresee long-term contracts with influencers becoming more common than one-off collaborations by 2030.
Influencer-led live shopping events could generate 2.2 times more purchase intent by 2028 than static posts.
42% of companies intend to allocate at least 20% of their total marketing budget to influencer collaborations by 2030.
Data-driven campaigns using AI analytics are expected to increase ROI by 18% by 2026 compared to campaigns without AI support.
29% of brands plan to incorporate more user-generated content alongside influencer posts to improve engagement by 2029.
Multi-influencer campaigns are projected to generate 1.9 times more audience interactions by 2028 than single-influencer campaigns.
Frequently Asked Questions
What is the average influencer marketing conversion rate?
Micro-influencer campaigns convert at an average of 4.1%, while macro-influencer campaigns average 2.6%. Click-through rates follow the same pattern: 2.4% for micro-influencers versus 1.1% for macro-influencers. Campaigns with a clear call-to-action in the caption convert 22% higher.
What is the ROI of influencer marketing?
Businesses earn an average of $5.78 for every $1 spent on influencer marketing, and 61% of brands say influencer content out-earns traditional display ads. Video-based campaigns convert 38% better than image-only campaigns.
How much do influencers charge per post?
Nano-influencers average $75 per Instagram Story, micro-influencers charge $185 to $320 per sponsored post, and macro-influencers range from $1,200 to $4,800 per post. On TikTok, rates average $2.04 per 1,000 views, compared to $3.12 on Instagram.
Are micro-influencers or macro-influencers better?
It depends on the goal. Micro-influencers win on engagement (5.7% vs 1.8%), conversion, and cost efficiency, and 61% of brands report higher ROI from them. Macro-influencers win on raw reach, averaging 650,000 people per campaign versus 48,000, and their giveaways attract 3.2x more entries.
The Bottom Line
The influencer world moves quickly, but the heart of it stays the same: people follow voices they trust. These 150+ statistics give you a snapshot of how the industry looks in 2026 and where it’s heading next.
Whether you’re working with a well-known creator or someone with a small but loyal following, the right match can bring your brand to life in ways ads alone can’t.
Use these numbers as a guide to plan smarter, spend wisely, and spot opportunities that others might miss.
At the end of the day, it’s not just about following trends. It’s about building genuine connections that leave a lasting impression.

A seasoned entrepreneur and AI enthusiast, Michael frequently shares insights on the intersection of technology and marketing. His writing focuses on leveraging artificial intelligence to enhance marketing strategies.
Create videos 10x faster and easier with Zebracat
Try it now


Comments