

Table Of Content


You’ve seen the trends, heard the sounds, and maybe even tried a few TikTok recipes yourself. In 2025, TikTok isn’t just another app on our phones.
From quick tutorials and relatable skits to unexpected brand moments, it’s the platform that has everyone’s attention, and the numbers prove it.
This collection of 150+ TikTok statistics offers a closer look at what’s going on behind the scenes. How often do people watch? What kind of content are they engaging with? Are ads working?
Whether you’re running a brand account, building your presence as a creator, or just trying to make sense of TikTok’s influence, the data here is designed to give you clarity.
Timely insights that help you stay grounded in what works, what’s changing, and where TikTok stands in today’s digital world.

User Demographics
TikTok users aged 18 to 24 make up 33% of the platform's total global audience in 2025.
In the United States, 61% of TikTok’s adult users identify as female, while 39% identify as male.

India accounts for 12.8% of TikTok’s total user base in 2025, the highest of any single country.
Among users aged 35 to 44, 41% report using TikTok at least once a day.
Gen Z users (aged 13 to 27) represent 57% of TikTok's global monthly active users.
In 2025, users aged 55 and above now make up 6.2% of TikTok’s audience, up from 3.9% in 2023.

The gender gap on TikTok is wider in Southeast Asia, where 67% of users are female.
Urban users account for 74% of TikTok’s daily engagement globally.
Compared to Instagram, TikTok has 1.7x more users aged 13 to 17 actively posting weekly.
Among all users in Europe, 28% fall in the 25-34 age group.
TikTok usage among users identifying as nonbinary or gender-diverse increased by 22% between 2022 and 2025.
Brazilian TikTok users aged 18 to 24 spend an average of 56 minutes daily on the app.
In 2025, 41% of TikTok’s U.S. audience identified as Hispanic, Black, or Asian-American.
TikTok has more rural users in China (39%) than in any other country, according to 2025 data.
Compared to Facebook, TikTok has 3.4x more users under the age of 21 in 2025.
Usage Behavior
In 2025, the average TikTok user spends 54 minutes per day on the app.
82% of TikTok users scroll through the For You page without searching for specific content.
Teen users aged 13–17 are 2.3x more likely to post weekly compared to users over 35.
Over 71% of users open TikTok more than five times per day.
42% of users prefer watching TikTok with captions on, even when audio is available.
Among U.S. users, 63% say they use TikTok to unwind before bed.
Saturday is the day with the highest average watch time, peaking at 62 minutes.

Video replies are used by 19% of active creators at least once a week.
Compared to YouTube Shorts, TikTok has 1.5x higher user retention for videos under 30 seconds.
38% of users say they often rewatch videos they've already liked.
In 2025, users under 25 are 3.2x more likely to engage with trending hashtags than those over 40.
Swipe-through rate (skipping before the video ends) averages 26%, lowest during the evening hours.
31% of global users report sharing TikToks outside the platform at least once a week.
On average, a user watches 92 videos per day in 2025, up from 78 in 2023.

Compared to Instagram Reels, TikTok users spend 27% more time per session.
Content Trends
In 2025, videos using storytelling formats saw 38% higher average watch time than standard clips.
Tutorial-style content grew by 41% in volume compared to 2023, especially in fashion and DIY niches.
TikToks with “day in the life” themes get 2.2x more shares than generic lifestyle videos.
Slow zoom effects appear in 17% of the top 1,000 trending TikToks.
57% of viral TikToks under 60 seconds include on-screen text within the first 3 seconds.
Videos featuring behind-the-scenes content saw a 29% boost in comment rates.
Compared to 2022, there’s been a 74% rise in videos that mix original audio with trending sounds.
Pet content remains one of the most rewatched genres, with a 64% rewatch rate.
Fashion hauls and GRWM videos receive 1.8x more average engagement than standard product showcases.
In 2025, creators using split-screen duets increased by 36%, mainly in education and comedy.
Lip-sync videos now account for only 4.9% of weekly trending content, down from 11.2% in 2021.

POV-style videos dominate the 18–24 age bracket, driving 47% of engagement in that demographic.
TikToks with hooks in the caption (e.g., “Watch till the end”) see 21% longer watch duration on average.
Animated content is now used by 9% of top creators monthly, more than doubling since 2022.
Compared to Instagram Reels, TikTok has 1.6x more viral content centered around niche subcultures like booktok or cleantok.
Creator Statistics
In 2025, TikTok had over 16.4 million active creators publishing at least once per month.
48% of creators post content in both niche and trending formats to balance reach and retention.
The average creator with 10,000–50,000 followers earns $378 per sponsored post.
Creators who post 3+ times per week are 2.5x more likely to see monthly follower growth over 8%.
Beauty and skincare creators saw a 32% rise in brand collaborations compared to 2023.
On average, it takes creators 19.7 videos to reach their first 1,000 followers.
Educational creators post longer videos, averaging 47 seconds, compared to 29 seconds for entertainment accounts.

Compared to Instagram, TikTok creators earn 1.6x more from affiliate links tied to short-form content.
58% of creators say they spend more time editing than filming their videos.
In 2025, 1 in 7 TikTok creators identify as full-time, up from 1 in 11 in 2022.
Creators using voiceovers in their videos receive 21% higher average completion rates.
Music-based creators were 3.1x more likely to trend weekly than creators in tech or education niches.
The most common posting frequency among creators is 4 times per week.
Creators who use their face in the first 2 seconds of a video report 44% higher engagement.
Compared to YouTube Shorts, TikTok creators post 2.2x more frequently per week on average.
Business & Advertising
In 2025, over 78% of small businesses on TikTok report using in-app tools for content promotion.
The average cost-per-click (CPC) on TikTok Ads is $0.73, slightly lower than Instagram’s $0.84.

Retail brands account for 36% of all paid promotions on TikTok, the highest among all industries.
47% of TikTok users say they’ve purchased a product after seeing it in a creator’s video.
Compared to 2023, there’s been a 62% increase in ad spending by businesses with under 50 employees.
Sponsored videos with native storytelling outperform direct promotional content by 2.1x in watch time.
The average conversion rate on TikTok Shop in 2025 is 3.4%, up from 2.7% in 2024.

Mid-sized brands (with 50k–500k followers) now generate an average of $2,900/month in TikTok-driven sales.
31% of business accounts use TikTok primarily for top-of-funnel brand awareness.
In a comparison of ROAS, TikTok Ads outperform Facebook Ads by 1.4x in the beauty sector.
Fashion-related ads receive 65% more average engagement than ads in tech or finance.
In 2025, 14% of all TikTok ad impressions come from carousel-style ad formats.
Brands that collaborate with micro-influencers (under 100k followers) see 27% more authentic engagement on average.
Video ads under 15 seconds now account for 53% of TikTok’s total advertising inventory.
Compared to Snapchat, TikTok drives 2.6x more product page visits per 1,000 impressions for DTC brands.
Engagement Metrics
In 2025, the average engagement rate across all TikTok content is 5.3%.
Videos with captions generate 23% more likes on average than those without.
The average TikTok video receives 18 comments, 243 likes, and 12 shares.
Creators with under 10,000 followers have an average engagement rate of 8.1%, compared to 3.7% for those above 500,000.
TikToks under 20 seconds receive 1.9x more full views than longer videos.
Duet-enabled videos see a 31% boost in total engagement compared to videos without interactive options.
Posts that include a question in the caption have a 44% higher comment rate.
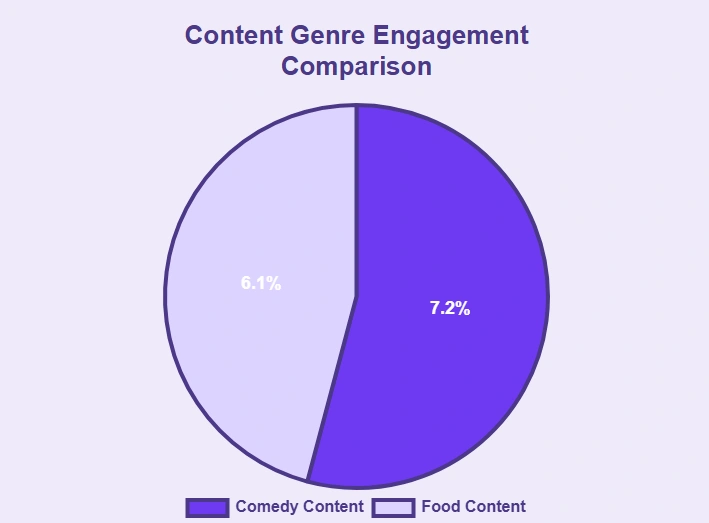
In a comparison of genres, comedy content leads engagement with an average of 7.2%, followed by food content at 6.1%.
Live streams on TikTok have an average viewer engagement rate of 12.4%, up from 9.8% in 2023.
TikToks posted between 6 PM and 9 PM local time perform 26% better in terms of likes.
Stitch-enabled content averages 2.3x more shares than standalone uploads.
In 2025, 18 to 24-year-olds contribute to 62% of all video likes across the platform.
Engagement for branded content peaks on Wednesdays, with an average 6.8% interaction rate.
Compared to Instagram Reels, TikTok videos receive 2.1x more shares per 1,000 views.
Videos that include creator reactions in the first 5 seconds see a 36% increase in average comment count.
Regional Data
In 2025, India will have the largest number of TikTok users, representing 12.8% of the global audience.
Brazilian users watch an average of 91 videos per day, the highest globally.
In the Philippines, TikTok is installed on 71% of all smartphones with internet access.

Germany saw a 46% increase in business accounts between 2023 and 2025.
TikTok usage in rural China accounts for 39% of total national watch time.
Compared to the U.S., Indonesia has 2.5x more daily video uploads per user.
In Japan, the average user session length is 13 minutes, slightly below the global average of 15 minutes.
Nigeria reported a 63% growth in TikTok creators between 2022 and 2025.
Among European countries, France has the highest engagement rate at 6.4%.
Mexico ranks second in Latin America for TikTok ad spending, behind Brazil, with an annual increase of 58% in 2025.
TikTok’s user base in the UK includes 68% of people aged 16 to 34.
In South Korea, content tagged with local trends receives 1.9x more shares than non-localized content.
The United States accounts for 9.7% of TikTok’s global ad impressions in 2025.
Compared to 2023, Canada saw a 35% increase in educational content creators.
In Egypt, TikTok usage peaks between 9 PM and 11 PM, with a 52% jump in engagement during that window.
Device & Platform Insights
In 2025, 94% of TikTok usage comes from mobile devices, with only 6% on tablets and desktops combined.

Android users represent 63% of TikTok’s total global user base.
TikTok’s app size varies by region, ranging from 239 MB in Europe to 297 MB in Southeast Asia.
The average load time for a TikTok video on Wi-Fi is 1.3 seconds, compared to 2.4 seconds on mobile data.
Compared to iOS, Android users experience 18% higher app crash rates on TikTok.
58% of users say they browse TikTok with their phone in vertical (portrait) mode only.
In-app editing tools are used in 71% of videos published directly from mobile devices.
TikTok’s desktop version accounts for only 3.2% of total watch time in 2025, down from 5.5% in 2022.

Compared to tablets, smartphones generate 4.6x more average engagement per session.
In 2025, users with 5G connectivity watch 27% more videos daily than those on 4G.
TikTok Lite is most popular in India, where it makes up 18% of all installs.
Smart TV app usage on TikTok has grown 41% since 2023, mostly for curated playlists.
TikTok’s battery usage is highest on devices older than 3 years, consuming an average of 11% battery per hour.
Compared to Snapchat, TikTok’s video rendering speed is 1.6x faster on high-end devices.
Foldable phones account for 2.7% of TikTok’s global video uploads in 2025, up from 1.1% in 2023.
Revenue & Growth
TikTok’s global revenue reached $15.4 billion in 2025, up from $12.1 billion in 2024.

The TikTok Shop contributed 21% of the platform’s total revenue in 2025.
In 2025, TikTok’s ad revenue from the U.S. market alone hit $5.2 billion, marking a 29% increase from 2023.
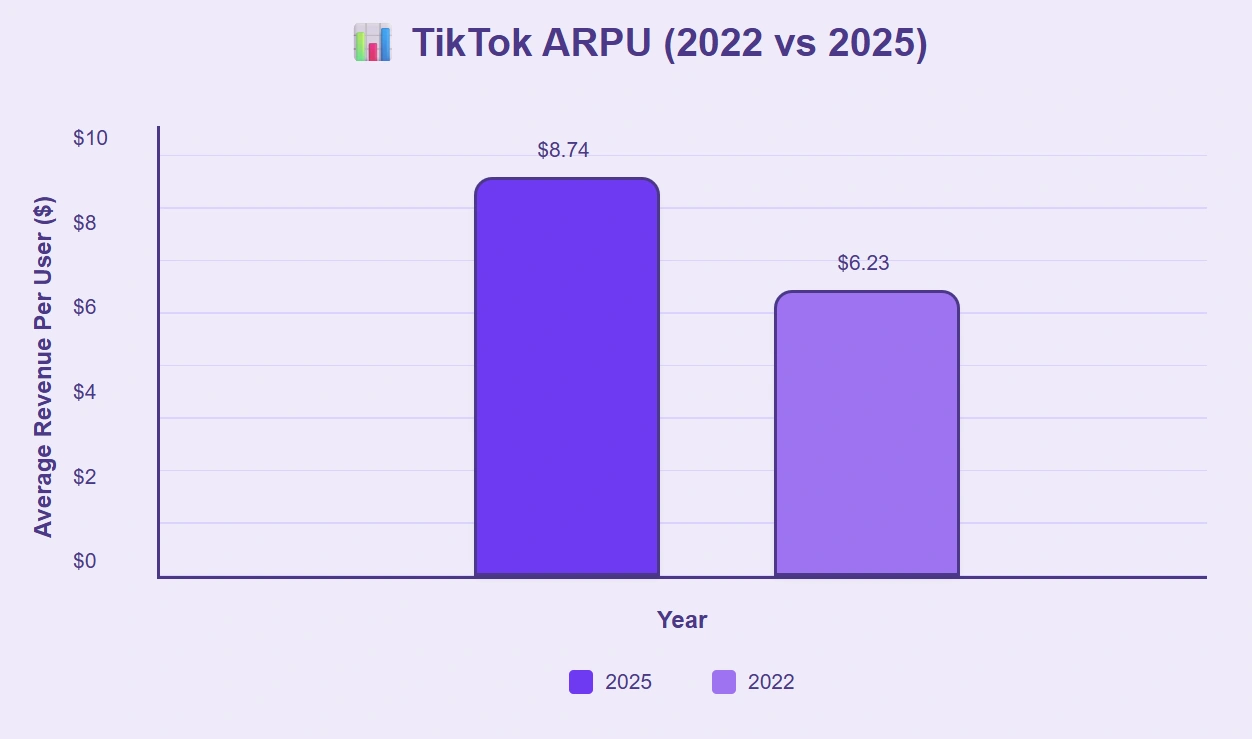
In 2025 TikTok’s average revenue per user (ARPU) is now $8.74, compared to $6.23 in 2022.
Compared to Instagram, TikTok generated 1.7x more revenue from short-form video ads in the beauty category.
Revenue from influencer partnerships on TikTok has grown 58% since 2023.
In-app purchases from TikTok Coins accounted for $1.1 billion in 2025, making up 7% of total platform revenue.
Brands using TikTok as a primary channel reported an average 14.3% increase in quarterly sales.
In Southeast Asia, TikTok’s monetized user base grew by 36% between 2023 and 2025.
TikTok now supports over 91,000 verified brand accounts actively spending on paid campaigns.
The platform saw a 47% growth in ecommerce-driven revenue in 2025 compared to the previous year.
Compared to 2021, TikTok’s total global revenue has increased by 203%.
Digital goods (like stickers, gifts, and coins) make up 11.4% of TikTok’s user-driven income in 2025.
TikTok’s revenue from small business advertisers surpassed $3.4 billion in 2025, nearly doubling since 2022.
In a comparison of year-over-year growth, TikTok outpaced Facebook by 1.3x in global ad revenue expansion.
Safety & Moderation
In 2025, TikTok removed 412 million videos globally for violating community guidelines.
27% of removed content in 2025 was flagged for minor safety violations, such as misleading medical claims.
TikTok’s automated moderation systems now detect and review 94% of policy violations before user reports are submitted.
Compared to 2022, TikTok reduced content takedown response time by 43%.
8.6 million accounts were permanently banned in 2025 for repeated harassment or hate speech violations.

Content containing graphic violence was 2.1x more likely to be flagged by users aged 18–24 than by other age groups.
TikTok’s live video moderation team handled an average of 127,000 sessions daily in 2025.
In 2025, 41% of all user reports were submitted within 15 minutes of content being published.
Compared to Instagram, TikTok issues 1.5x more warnings before permanently removing a user account.
TikTok introduced 6 new regional moderation hubs between 2023 and 2025 to handle growing safety demands.
Videos with sensitive content labels had a 36% lower average share rate.
Family Pairing controls are now enabled by 19% of users aged 13–17, up from 12% in 2023.
TikTok received 3.2 million privacy-related requests from users in 2025, a 48% increase from the previous year.
Content flagged for misinformation was reduced by 31% between 2023 and 2025 through stricter filters.
Compared to YouTube Shorts, TikTok removes 2.4x more videos related to misinformation within 24 hours of upload.
The Bottom Line
After going through all the numbers, one thing is clear. TikTok isn’t slowing down.
What once felt like a platform for fun, off-the-cuff videos has grown into something much bigger. It’s where people spend their time, find new products, follow creators they trust, and explore ideas that spark curiosity.
In 2025, TikTok is part of the everyday scroll, and that makes it a space worth understanding.
These 150+ stats aren’t just about performance. They’re about patterns. They show what grabs attention, what keeps people watching, and what drives action.
Whether you’re here to grow your audience, test new strategies, or just keep up with how things are shifting, this data gives you something solid to work with. Because at the end of the day, staying informed helps you show up with purpose.
And when it comes to TikTok, that makes all the difference.

A seasoned entrepreneur and AI enthusiast, Michael frequently shares insights on the intersection of technology and marketing. His writing focuses on leveraging artificial intelligence to enhance marketing strategies.
Create videos 10x faster and easier with Zebracat
Try it now


Comments