

Table Of Content


Digital marketing moves fast, and 2025 is already full of changes. Algorithms are evolving, audience habits are shifting, and marketers are constantly adjusting to keep up.
With so much happening at once, it can be hard to know what’s making an impact. That’s where data comes in.
This collection includes over 250 statistics that reflect what’s working right now. From content and SEO to paid ads, email, and social media, these numbers offer a clear look at where people are spending time, what tools they’re using, and which strategies are delivering results.
Whether you're planning your next campaign or simply staying informed, these insights help you stay focused on what matters most. Instead of relying on trends or guesswork, you can use real data to make smart, confident marketing decisions.

Global Digital Marketing Overview
In 2025, global digital marketing spend reached $602 billion, up from $521 billion in 2023.

Marketers now allocate an average of 67% of their total budget to digital channels, compared to 59% in 2022.
Asia-Pacific contributes 38% of global digital ad spend, followed by North America at 31% and Europe at 23%.
In 2025, B2B marketers report a digital ROI increase of 34%, while B2C marketers report 48%.
Search ads and social media combined account for 71% of all digital ad spending globally.
The average cost per acquisition (CPA) for digital campaigns globally is $27, a drop from $32 in 2023.
Companies in retail spend an average of $11.2 million annually on digital marketing, compared to $7.6 million in the financial sector.
Marketers working at companies with under 50 employees invest 54% of their marketing budget in digital, while those at companies with over 1,000 employees invest 72%.
Social media ad budgets rose by 22% in Europe between 2023 and 2025, while the increase was 35% in the Middle East and 18% in the US.

The average click-through rate (CTR) across all digital ads globally is 1.9%, up from 1.5% in 2022.
Email open rates in Latin America hit 31%, compared to 25% in North America and 18% in Asia.
In 2025, global marketers report increased ROI from video-first strategies, with 61% seeing better performance than with static content.
Mobile advertising now represents 64% of global digital ad spend, up from 56% in 2021.
Digital campaign lifespans shortened to an average of 18 days in 2025, compared to 26 days in 2021.
89% of marketing teams worldwide use at least three digital channels in every campaign.
74% of digital marketers consider audience data accuracy their top challenge in 2025.
Social Media Marketing Statistics
In 2025, 94% of marketers use social media as part of their core strategy.
Brands post an average of 4.3 times per week across their primary social media platforms.
Instagram remains the top platform for engagement with an average rate of 1.8%, compared to 1.2% on Facebook and 0.6% on LinkedIn.

Video posts on X (formerly Twitter) get 47% more engagement than image-only tweets.
Short-form videos on TikTok drive 39% higher conversion rates than photo posts on Instagram in 2025.
B2C marketers are 2.3 times more likely to use TikTok than B2B marketers in 2025.
Influencer marketing spending rose to $21.5 billion globally in 2025, up from $18.1 billion in 2023.
Brands using Reels on Instagram report 33% higher follower growth than those not using video content.
LinkedIn is the top-performing platform for B2B lead generation, used by 78% of B2B marketers compared to 41% using Facebook.

In 2025, retail brands allocate 42% of their social media ad budget to Instagram, compared to 31% to TikTok and 17% to Facebook.
The average social media ad click-through rate in 2025 is 1.6%, up from 1.3% in 2022.
Social media accounts for 31% of all referral traffic to e-commerce websites globally.
Brands using UGC (user-generated content) on social media see 28% higher engagement than brands using branded content only.
Among marketers aged 25–34, 62% prefer using TikTok for brand awareness campaigns, compared to 38% for Instagram.
In 2025, customer service interactions via social media increased by 46% compared to 2022.
Brands that actively respond to comments on social media see 23% more repeat purchases on average than brands that don't engage.
SEO and Organic Search Statistics
In 2025, 67% of all website traffic still comes from organic search.
The average click-through rate (CTR) for the first organic Google result is 28.4%, compared to 15.7% for the second and 9.2% for the third.

Websites that publish content at least once per week receive 61% more organic traffic than those that publish less frequently.
In 2025, 91% of marketers say SEO is a top long-term growth strategy.
Mobile search now makes up 63% of all organic traffic, up from 58% in 2023.
Pages that load in under 2.5 seconds rank 45% better on average than slower pages.
In the SaaS industry, organic traffic accounts for 52% of total website visits, compared to 39% in the finance industry and 34% in e-commerce.
88% of SEO professionals now integrate AI tools into their keyword research workflows.
Pages optimized for featured snippets see a 29% boost in CTR compared to those in standard positions.
Local businesses that maintain up-to-date Google Business Profiles see 32% more search traffic than those that don’t.
In 2025, long-form content (2,000+ words) ranks on the first page 72% of the time, compared to 27% for shorter pages under 800 words.
B2B companies generate 68% of their leads through organic search, while B2C companies generate 51%.

Blogs that include internal links every 200 words retain visitors 36% longer on average than those with minimal linking.
SEO budgets for mid-sized businesses rose by 19% between 2023 and 2025, while small businesses increased theirs by 11%.
Companies using schema markup see 24% higher impressions in search results than companies without it.
In 2025, 61% of marketers say their SEO strategy performs better than paid ads in terms of long-term ROI.
Paid Advertising (PPC) Statistics
In 2025, businesses are spending an average of $11.80 per click on Google Ads across all industries.
The average return on ad spend (ROAS) for PPC campaigns in 2025 is 3.9x.
E-commerce brands see an average PPC conversion rate of 5.4%, compared to 3.1% for service-based businesses.
The average cost per lead (CPL) from paid search in 2025 is $41, compared to $62 from display ads.
In the real estate industry, PPC ads generate an average CTR of 2.3%, while the healthcare sector averages 1.6%.
B2B companies allocate an average of 38% of their total ad budget to PPC, compared to 51% for B2C brands.
Video-based ads on YouTube receive 23% higher engagement than static image ads on Google Display Network.
In 2025, 82% of digital advertisers run ads on more than one platform simultaneously.
The click-through rate for branded search ads is 5.9%, while non-branded ads average 2.8%.
Retargeting campaigns generate 37% more conversions than first-touch PPC ads in 2025.
91% of PPC advertisers report improved performance when combining paid search with organic SEO strategies.
The average bounce rate for PPC landing pages in 2025 is 42%, down from 49% in 2023.
Mobile devices account for 69% of all PPC ad clicks in 2025, up from 63% in 2022.

Brands that A/B test ad copy weekly see 31% higher conversion rates than brands that test less frequently.
Local businesses using location-based PPC targeting receive 28% more store visits than those using generic regional targeting.
In 2025, 64% of advertisers say PPC gives them faster insights for campaign decisions compared to organic content.
Content Marketing Statistics
In 2025, 89% of marketers say content marketing drives higher long-term ROI than paid advertising.
The average blog post length is now 1,730 words, up from 1,430 words in 2022.
Marketers who publish four or more blog posts per month see 48% more traffic than those who publish less than once per month.
In 2025, B2B marketers allocate 42% of their total marketing budget to content, compared to 35% for B2C marketers.
Video content generates 56% more engagement than articles alone when used in social distribution.
73% of marketing teams now have a documented content strategy in place, up from 61% in 2023.
Interactive content increases average time-on-page by 38% compared to static blog posts.
Marketers working with a team of 3 or more see 33% better content performance than solo creators.
Email newsletters remain the top content distribution channel for 62% of marketers in 2025.
Case studies are rated as the most effective content format by 45% of B2B marketers and 28% of B2C marketers.

Repurposing existing content accounts for 29% of the average content calendar in 2025.
Companies that include visuals in over 70% of their content see 40% higher reader retention rates.
Content teams using AI tools for brainstorming and outlining report 31% faster production cycles than teams using manual workflows only.
Blogs with embedded audio (like podcast clips) get 22% more shares on average than blogs without multimedia.
Educational content drives 51% of traffic for SaaS brands, while product-led content drives 61% for e-commerce brands.
In 2025, 68% of marketers say their content marketing results are easier to measure than they were in 2022.
Email Marketing Statistics
In 2025, the average email open rate across all industries is 31.2%, up from 27.4% in 2023.
Emails sent on Tuesdays have a 17% higher open rate than those sent on Fridays.
The average click-through rate (CTR) for marketing emails in 2025 is 4.6%.
B2B email campaigns see a 19% higher reply rate than B2C campaigns.
Welcome emails generate 86% more engagement than standard promotional emails.
Marketers who segment their email lists see 37% higher CTRs than those who send to broad lists.
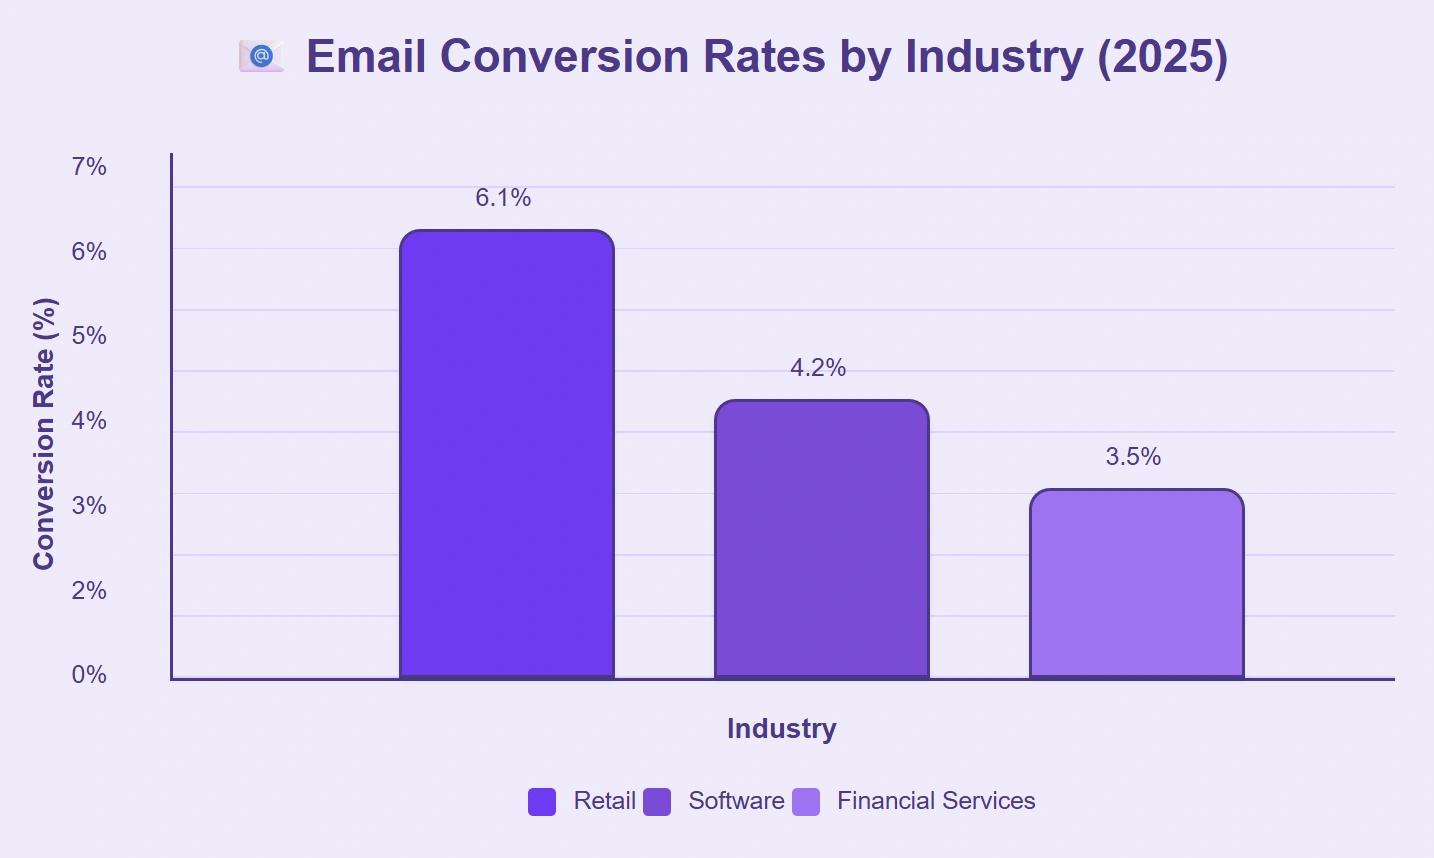
In 2025, retail brands achieve an average email conversion rate of 6.1%, compared to 4.2% for software companies and 3.5% for financial services.
Abandoned cart emails generate an average revenue of $5.14 per recipient.
Personalized subject lines increase open rates by 22% compared to generic ones.
Email remains the top content delivery channel for 78% of marketers in 2025.
Mobile devices account for 61% of all email opens in 2025, compared to 56% in 2022.
Companies with fewer than 10 employees average 2.1 email campaigns per week, while companies with over 1,000 employees send 4.6 per week.
Email newsletters with visuals get 26% more clicks than text-only formats.
SaaS companies report an average of $42 ROI for every $1 spent on email marketing, while e-commerce brands report $38.

Drip campaigns result in 24% more conversions than one-time promotional emails.
In 2025, 69% of marketers say email marketing is their highest-performing channel for lead nurturing.
Video Marketing Statistics
In 2025, 91% of marketers say video is essential to their content strategy.
The average viewer retention for videos under 60 seconds is 71%, compared to 42% for videos over 5 minutes.

Short-form videos deliver 46% more engagement on average than traditional blog posts.
Product videos increase purchase intent by 34% compared to static images.
YouTube leads as the top video platform for marketers, used by 84%, followed by Instagram at 69% and TikTok at 57%.
B2B brands report a 28% higher lead quality when using video landing pages versus static ones.
62% of consumers say they feel more confident buying a product after watching a video about it.
E-commerce brands that use product demo videos see 18% fewer returns than those that don't.
Brands using subtitles on social media videos achieve 26% higher completion rates.
Companies with in-house video teams publish 2.7 times more video content per month than those outsourcing production.
Educational videos have an average watch time of 3 minutes and 22 seconds, compared to 1 minute and 47 seconds for brand ads.
Mobile video accounts for 74% of all video views in 2025, up from 67% in 2023.
Landing pages with embedded video convert 38% better than pages without video.
SaaS companies use explainer videos in 59% of onboarding processes, compared to 42% in the financial sector.

79% of video marketers say videos have directly increased sales in 2025.
In 2025, 87% of marketers track video performance using platform-specific analytics, rather than third-party tools.
Influencer Marketing Statistics
In 2025, global spending on influencer marketing reached $28.4 billion, up from $23.6 billion in 2023.

81% of marketers say influencer content performs better than brand-created content on social media.
Micro-influencers (10K–100K followers) deliver 43% higher engagement rates than macro-influencers (over 500K followers).
In the beauty industry, influencers drive 54% of total online product discovery, compared to 39% in fitness and 27% in tech.
Brands working with influencers on TikTok see 32% higher average video completion rates than those using Instagram Reels.
Influencer collaborations now account for 41% of total social media marketing budgets.
B2C companies are 2.4 times more likely to use influencer partnerships than B2B companies in 2025.
Sponsored influencer posts with product demos generate 29% more clicks than standard lifestyle content.
67% of marketers now use influencers for both reach and conversions, not just awareness.
Influencer whitelisting campaigns show a 22% lower cost-per-click than traditional branded ads.
Instagram remains the top platform for influencer marketing in 2025, used by 83% of brands, followed by TikTok at 72%.
Influencers aged 18–24 have a 48% higher engagement rate on average than those aged 35–44.
76% of marketers say they prefer long-term partnerships with influencers over one-off campaigns.
Giveaways hosted by influencers increase follower count by an average of 19% within seven days.
Influencer content featuring real customer testimonials sees 35% higher trust ratings from viewers than scripted content.
In 2025, 69% of consumers say they are more likely to trust a product if it’s promoted by someone they follow.
Mobile Marketing Statistics
In 2025, 72% of all digital ad spending is allocated to mobile platforms.
Mobile e-commerce sales account for 61% of total online purchases globally.
Push notifications on mobile apps have an average open rate of 18.7%, compared to 6.3% for email on desktop.
In the travel industry, 74% of mobile bookings happen within 48 hours of the intended trip, compared to 42% on desktop.
Mobile users spend an average of 3 hours and 28 minutes daily on their devices in 2025.
SMS marketing campaigns see a 98% open rate, with most messages read within 3 minutes of delivery.
Brands using mobile-optimized video ads report 27% higher engagement than those running desktop-first creatives.
B2C marketers prioritize mobile web optimization 2.6 times more than B2B marketers in 2025.
The average mobile page load speed is 2.9 seconds, down from 3.4 seconds in 2023.
In 2025, retail brands generate 49% of mobile conversions from in-app ads, compared to 34% from browser-based ads.
Mobile devices now represent 69% of all organic search traffic, up from 64% in 2022.

Location-based mobile ads increase foot traffic by 22% on average.
Apps with personalized content see 35% higher session times than non-personalized apps.
In-app video ads have a 2.4% CTR, while mobile banner ads average 0.9%.
88% of mobile marketers in 2025 report better ROI when using real-time behavioral targeting.
Mobile app installs from paid campaigns rose by 26% between 2023 and 2025.
E-commerce and Conversion Statistics
In 2025, the global e-commerce market is valued at $6.5 trillion, up from $5.3 trillion in 2023.
The average e-commerce conversion rate across all industries is 3.7% in 2025.
Mobile devices account for 59% of all e-commerce transactions, while desktop accounts for 38% and tablets for 3%.

In the fashion sector, conversion rates average 4.3%, compared to 2.9% in electronics and 5.1% in health and wellness.
Cart abandonment rates are 69% on average, with the top reasons being unexpected costs and complicated checkout.
Product pages with customer reviews convert 31% better than those without reviews.
Free shipping increases conversion rates by 22% on average.
E-commerce brands offering one-click checkout see 18% higher purchase completion rates.
In 2025, email drives 27% of total e-commerce conversions, while paid search contributes 34% and social media 19%.
Websites that load in under 3 seconds see 44% more conversions than slower sites.
In the U.S., desktop users have a 3.2% conversion rate, while mobile users convert at 2.8%, and tablet users at 3.5%.
Personalized product recommendations increase average order value by 14%.
Subscription-based e-commerce businesses have a 62% customer retention rate, compared to 38% for one-time purchase models.
In 2025, A/B testing of product pages results in 21% higher revenue per visitor.
B2C online stores average 2.9% conversion rates, while B2B platforms average 5.4%.
77% of e-commerce brands say improving the checkout experience was their top conversion focus in 2025.
Marketing Automation and AI Statistics
In 2025, 84% of marketing teams use automation tools as part of their daily workflow.
AI-assisted email campaigns have a 41% higher open rate than manually written ones.
The average time saved per week using marketing automation tools is 9.5 hours.
B2B marketers use automation for lead nurturing 62% of the time, compared to 47% for B2C marketers.
AI-generated ad copy results in 28% higher click-through rates than non-AI versions.
77% of marketers say AI helps them analyze campaign performance faster and more accurately.
Companies using predictive AI for customer segmentation see a 22% increase in conversion rates.
In 2025, marketing platforms with built-in automation see 31% more usage than platforms without automation features.
Small businesses with under 20 employees use automation tools in 38% of their campaigns, compared to 79% for enterprises with over 1,000 employees.

AI-based chatbots handle 63% of first-response support tickets in marketing teams.
Automated A/B testing tools deliver results 3.2 times faster than manual testing methods.
In the e-commerce sector, AI-powered product recommendations boost average order value by 16%.
91% of marketers say automation improves their ability to personalize customer journeys at scale.
The use of AI for content creation increased by 46% between 2023 and 2025.
Companies using a combination of AI and human-led workflows report 33% higher campaign ROI than those using AI alone.
In 2025, 69% of marketing automation users integrate at least four platforms into one central workflow.
Consumer Behavior and Trends
In 2025, 79% of consumers say they expect personalized experiences from brands they interact with.
62% of online shoppers are more likely to buy from brands that remember their preferences across platforms.
Consumers aged 18–24 engage with brand emails 52% more frequently than those aged 45–54.
In 2025, 84% of consumers check product reviews before making a purchase decision.
Mobile-first users are 37% more likely to abandon a website that takes longer than 3 seconds to load compared to desktop-first users.
48% of consumers have purchased a product directly through a social media platform in the last 30 days.
Brands that respond to comments or messages within 2 hours are rated as more trustworthy by 67% of consumers.
Subscription-based purchases have grown by 31% between 2023 and 2025.
In 2025, 44% of Gen Z consumers prefer learning about products through short videos, while only 18% of Baby Boomers say the same.

Voice-assisted shopping now accounts for 8.6% of all online purchases.
71% of consumers say they are more loyal to brands that share their values.
Eco-conscious consumers are 2.2 times more likely to switch brands based on sustainability efforts.
Cart abandonment due to a lack of payment options affects 29% of online shoppers.
Consumers exposed to a product on three or more platforms are 46% more likely to convert than those who only see it once.
Loyalty program members spend 31% more per order than non-members on average.
In 2025, 65% of consumers say they have unsubscribed from brand communications due to receiving too many irrelevant messages.
B2B Digital Marketing Statistics
In 2025, 87% of B2B companies say digital marketing is their primary lead generation channel.
The average cost per lead (CPL) in B2B digital marketing is $78, down from $94 in 2023.
B2B buyers consume an average of 7.3 pieces of content before contacting a sales rep.
LinkedIn drives 64% of all B2B social media traffic, compared to 21% from Twitter and 12% from Facebook.

Email remains the most-used channel for B2B marketing, with 92% of B2B marketers relying on it regularly.
B2B companies using account-based marketing (ABM) see 27% higher engagement than those using standard broad targeting.
In 2025, 61% of B2B marketers report improved ROI from SEO compared to paid search.
Webinars convert 22% more leads than downloadable whitepapers in B2B lead generation.
49% of B2B marketers use marketing automation to qualify leads before passing them to sales.
B2B websites that offer live chat support generate 34% more leads than those without it.
SaaS-based B2B companies allocate 46% of their marketing budget to digital, while manufacturing companies allocate 31%.
The average B2B sales cycle length is 82 days, compared to 56 days in 2022.
Companies producing weekly blog content report 2.3 times more leads than those publishing monthly.

Mobile usage accounts for 39% of B2B website traffic in 2025, up from 32% in 2023.
B2B marketers using video in product pages report 29% higher conversion rates than those using text-only formats.
In 2025, 74% of B2B decision-makers say they prefer self-service research over speaking with a sales rep.
Local and Voice Search Statistics
In 2025, 58% of all Google searches are local in intent.

76% of users who perform a local search on mobile visit a related business within 24 hours.
Voice search is used by 43% of consumers weekly to find local businesses.
Local listings with complete business profiles get 2.6 times more clicks than those with missing details.
In the restaurant sector, voice search accounts for 38% of local discovery, compared to 21% in the retail sector.
Mobile users are 2.4 times more likely to use voice search for location-based queries than desktop users.
Businesses with over 100 reviews have a 32% higher chance of appearing in the top 3 local search results.
In 2025, 64% of consumers say they trust businesses more when listings show up across multiple local directories.
B2C service businesses (like salons and auto repair) receive 41% of their total leads from local SEO, while B2B service firms get 24%.
Voice-enabled devices are present in 71% of U.S. households, up from 62% in 2023.
"Near me" searches have increased by 18% year-over-year since 2022.
Listings with photos receive 35% more direction requests in Google Maps than those without.
Local businesses using location-based schema markup see a 27% boost in visibility.
In 2025, 59% of voice searches result in a business call or store visit within the same day.
Businesses ranked in the top 3 of Google’s local pack receive 72% of all clicks for that search.
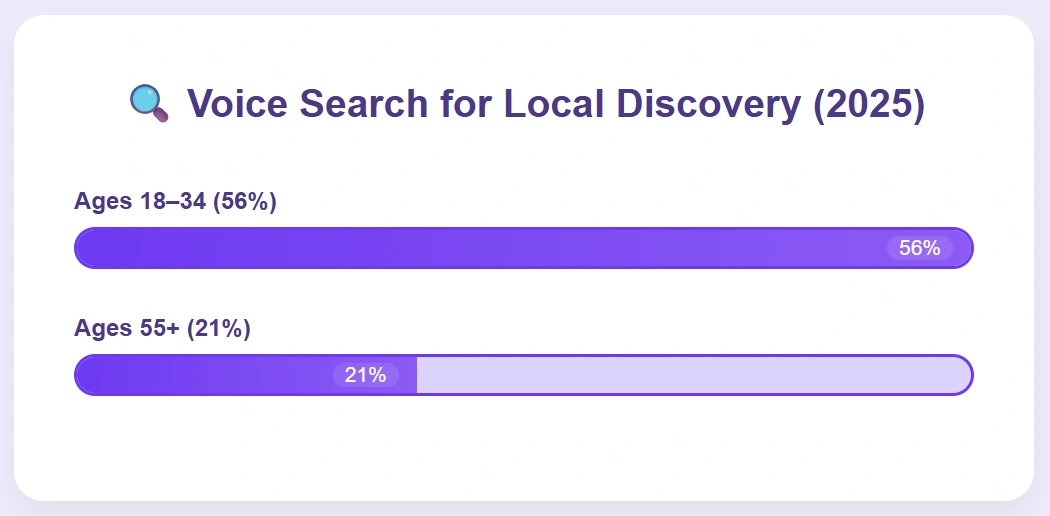
Voice search users aged 18–34 use it for local business discovery 56% of the time, while users aged 55+ do so only 21% of the time.
Digital Marketing ROI and Budget Statistics
In 2025, the average ROI for digital marketing campaigns is $4.28 for every $1 spent.
69% of marketers say they increased their digital budgets compared to 2023.
Paid search delivers an average ROAS of 3.7x, while display ads average 2.4x.
B2B companies allocate 42% of their total marketing budget to digital, compared to 55% for B2C brands.
Email marketing continues to offer the highest ROI among digital channels, returning an average of $42 per $1 invested.
Companies that track ROI by channel report 33% more efficient budget allocation than those that don’t.
In 2025, digital marketing accounts for 68% of total marketing budgets globally.
Mid-sized companies (50–500 employees) spend an average of $8,600 per month on digital marketing, while large enterprises spend $19,200.
Marketers who invest in attribution tools report 26% higher campaign ROI on average.
Influencer marketing produces a return of $5.10 per $1 spent for retail brands, compared to $3.40 for financial services.

Companies that increased video ad spend by over 20% in 2025 saw a 17% lift in brand recall.
73% of marketers say budget flexibility allows them to adapt faster to changing consumer behavior.
SaaS companies dedicate 38% of their digital budget to content marketing, while e-commerce brands spend 47% on paid media.
Brands that reassess their digital budget quarterly see 19% higher performance than those adjusting annually.
In 2025, 87% of CMOs say proving ROI is a top priority when securing budget approvals.
Marketers using performance-based budgeting frameworks report 21% greater year-over-year revenue growth.
The Bottom Line
Data doesn’t have to be complicated to be helpful. After going through these statistics, one thing is clear: strong marketing comes from a clear strategy, not guesswork.
These numbers offer a real look at what’s working in 2025. From the tools teams rely on to the formats that drive results, every stat adds a piece to the bigger picture. It’s not about following every new idea.
It’s about understanding what fits your goals, your audience, and your time.
Whether you're running solo, leading a team, or just getting started, these insights can help you make more confident decisions. Use them to support your next move, adjust your strategy, or spark fresh ideas.
The digital marketing world keeps moving, but with the right information, you can keep moving with it.

A seasoned entrepreneur and AI enthusiast, Michael frequently shares insights on the intersection of technology and marketing. His writing focuses on leveraging artificial intelligence to enhance marketing strategies.
Create videos 10x faster and easier with Zebracat
Try it now


Comments