

Table Of Content


Marketers still need to know what works. With so many platforms, formats, and tools to choose from, it’s easy to get lost in the noise.
That’s why I prepared the list of over 250 advertising statistics. These numbers reflect what marketers are doing right now, what audiences are responding to, and where budgets are being spent for real results.
Whether you’re running paid campaigns, testing creative strategies, or just trying to get a clearer picture of the current landscape, this roundup gives you a solid starting point.
You’ll find insights on everything from video performance and ad placements to audience preferences and ROI benchmarks.
No theories, just data that tells a story. If you want to make smarter ad decisions, save time on trial and error, or just stay sharp, this is where to begin.

Global Advertising Spend
Global advertising spend reached $889 billion in 2025, marking a 7.3% increase from the previous year.
Digital ad formats account for 71% of total global spend, with TV and print making up the remaining 29%.

The Asia-Pacific region surpassed North America for the first time, contributing 35% of global ad spend compared to North America’s 33%.
Programmatic advertising represents 63% of global digital spend, continuing its steady annual growth since 2018.
Video advertising alone commands 29% of digital budgets worldwide, while display ads follow at 21%.
Retail brands led global ad spending in 2025, investing over $97 billion, outpacing tech companies by $11 billion.
Mobile ad spending made up 58% of all digital ad dollars, while desktop ad spending declined to 19%.
Brands in the U.S. spent an average of $426 million per company on advertising, compared to $291 million in Western Europe.
Latin America's ad spend rose 12% year-over-year, the fastest-growing region globally in percentage terms.
Global paid search investment reached $189 billion, narrowly beating out social media ads at $181 billion.

Consumer packaged goods companies increased their global ad spend by 9%, while automotive brands cut back by 4.5%.
Out-of-home (OOH) advertising grew to $37 billion globally, outperforming cinema ads, which stalled at $3.6 billion.
Influencer-driven media buys now represent $21.4 billion of worldwide spend, led by lifestyle and beauty brands.
Africa’s total ad spend in 2025 reached $14.2 billion, up from $12.8 billion the year prior.
In B2B sectors, average global ad budgets grew to $5.8 million per company, compared to $3.9 million in 2023.
The Middle East saw a 6.2% increase in ad spend, led by government and tourism campaigns.
Global spend on native advertising crossed $98 billion, overtaking banner ads for the first time.
Digital Advertising Statistics
Digital advertising accounts for 71% of total global ad spend in 2025, up from 67% in 2024.

Search, social, and video remain the top three formats, with a combined share of 82% of all digital budgets.
Google Ads maintains its lead, attracting 41% of global digital ad spend, compared to Meta's 29%.
Programmatic digital ad placements reached $420 billion, making up 66% of total digital spend.
The average click-through rate for display ads sits at 0.71%, while native ads perform better at 1.13%.
Short-form video ads have an average completion rate of 67%, compared to 39% for longer-form ads.
E-commerce brands spend 33% of their digital budget on paid social, nearly double that of service-based businesses at 17%.
Mobile devices drive 62% of all digital ad impressions globally, while desktops account for 21%.

Digital ad fraud losses are estimated at $52 billion, with most occurring in programmatic video and app inventory.
Retargeting ads convert 43% more than standard display ads on average.
The average cost per thousand impressions (CPM) for Facebook Ads is $11.20, slightly higher than Instagram's $10.60.
YouTube pre-roll ads see a 54% view-through rate, outperforming mid-roll formats, which sit at 38%.
Brands targeting Gen Z spend an average of $2.1 million more annually on TikTok ads than those targeting millennials.
Interactive ad formats (like polls or sliders) have a 36% higher engagement rate than static image ads.
The average digital ad spend per internet user globally is now $124 in 2025, up from $109 in 2024.
Streaming platforms now capture 19% of total digital video ad budgets, led by YouTube, Hulu, and regional players.
Vertical video ads drive 21% higher engagement on mobile than horizontal formats.
Social Media Advertising
Social media ad spend hit $181 billion in 2025, making up 26% of total global advertising.
Instagram Stories account for 38% of Meta’s total ad revenue, while Facebook Feed ads bring in 44%.

TikTok ads now average a 6.1% engagement rate, nearly triple that of Twitter ads at 2.2%.
The average cost per click (CPC) on LinkedIn is $5.82, the highest among all major platforms.
Carousel ads on Instagram receive 23% more interaction than single-image ads.
Brands running influencer campaigns on TikTok spend an average of $42,000 per campaign, compared to $28,000 on Instagram.
Snapchat’s ad impressions rose 14% year-over-year, fueled by growth in augmented reality placements.
Facebook remains the top platform for lead generation ads, responsible for 49% of all social leads in 2025.
Reels ads on Instagram generate 27% more video completions than Feed-based video ads.
B2B brands favor LinkedIn for paid social, allocating 61% of their social ad budget to the platform.
Retail advertisers spend 35% of their social media budget on Meta platforms, compared to 21% on TikTok.
Twitter’s ad revenue declined by 8.7% in 2025, while Pinterest saw a modest 4.2% growth.
The average social media ad campaign runs for 17 days, with video-heavy campaigns extending to 24 days on average.
Boosted posts on Facebook have a 48% lower reach per dollar spent compared to properly targeted ad sets.
Click-through rates on sponsored LinkedIn posts average 0.55%, while sponsored Facebook posts see 0.91%.
YouTube Shorts now represent 13% of all YouTube ad views in 2025, up from 6% in 2024.

Influencer-sponsored content performs best on Instagram, generating 34% more engagement than similar content on TikTok.
Mobile Advertising
Mobile ad spend reached $514 billion in 2025, accounting for 58% of all global ad spend.
In-app ads represent 63% of total mobile ad revenue, compared to 37% from mobile web placements.
Mobile video ads now make up 41% of total mobile ad spend, led by short-form vertical formats.
The average mobile click-through rate is 1.37%, slightly higher than desktop’s 1.11%.
Mobile programmatic ad buying accounts for 72% of all mobile campaigns, up from 68% last year.
Gaming apps generate 32% of global in-app ad impressions, followed by entertainment at 26%.
The average mobile ad viewability rate is 73%, while desktop ads average 61%.
Users spend an average of 4.8 hours daily on mobile devices, with 18% of that time exposed to ads.
App install ads have a 12.3% conversion rate, compared to 8.9% for mobile landing page ads.
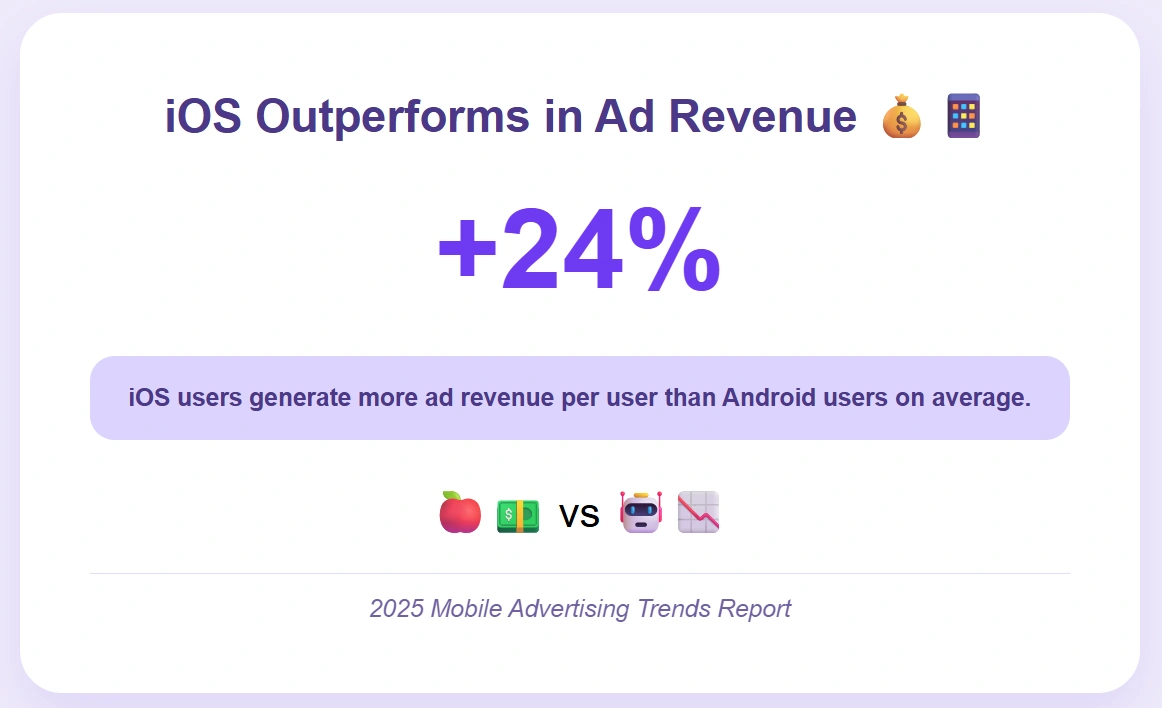
iOS users generate 24% higher ad revenue per user than Android users on average.
The average CPM for mobile video ads is $14.72, compared to $9.18 for banner ads.
Mobile ads with location-based targeting perform 32% better in engagement than non-targeted mobile ads.
Mobile search ads now represent 44% of all paid search clicks worldwide.
Interactive mobile ads (like swipeable or tap-to-expand) show 2.1x more engagement than static ads.
The average bounce rate from mobile ad clicks is 29%, while desktop bounce rates hover around 35%.
Brands allocate 67% of their social media ad budgets to mobile-specific placements.
The Middle East and Southeast Asia report the highest mobile ad growth, both exceeding 18% year-over-year.
Video Advertising
Video ad spend reached $198 billion in 2025, making up 22% of global advertising budgets.
Short-form video now accounts for 57% of all video ad placements, up from 49% the year before.

YouTube continues to dominate, capturing 41% of all video ad revenue, while TikTok follows at 26%.
The average completion rate for 15-second video ads is 72%, compared to 48% for 30-second spots.
Pre-roll video ads have a 61% view-through rate, while mid-roll placements see only 39%.
Brands running video ads on Instagram Reels see 33% higher engagement than those using traditional Instagram Feed videos.
Interactive video ads (with polls, swipes, or CTAs) boost conversion rates by 26% over standard video formats.
In 2025, over 48% of performance marketers reported using AI text-to-video tools to create quick ad variations for A/B testing across social platforms.
Brands that use AI Instagram Reels generators saw a 37% higher engagement rate on their paid Reels campaigns compared to manually created content.
Nearly 42% of small businesses running TikTok ads in 2025 are relying on AI-generated TikTok videos to keep up with the demand for fresh ad creatives.
Marketers using AI YouTube video generators in their ad strategy report a 28% boost in CTR, thanks to faster production of video ads tailored for search and discovery.
YouTube Shorts ad campaigns powered by AI Shorts generators are estimated to outperform traditional video ads by 31% in completion rate.
Faceless videos now account for over 53% of ad creatives on platforms like TikTok and YouTube Shorts, as brands prioritize scalable, AI-generated content that doesn’t rely on on-camera talent.
B2C brands allocate 34% of their digital budget to video, compared to 18% for B2B companies.
TikTok video ads have an average watch time of 9.7 seconds, outpacing Instagram Reels at 7.8 seconds.
Mobile video ad impressions represent 69% of total video views, with tablets and desktops trailing behind.
Retail and fashion sectors lead video ad spending, investing $38.6 billion collectively in 2025.
Skippable ads on YouTube have a 5.2% click-through rate, while non-skippable formats average 2.9%.

Silent autoplay video ads still retain viewer attention for an average of 4.3 seconds.
Brands using vertical video formats report a 28% increase in mobile engagement versus horizontal formats.
Video ads embedded in email campaigns increase CTR by 38% on average.
Programmatic video ads account for 61% of all video ad buys globally.
Social video ads outperform display video ads in ROI by 2.4x for consumer brands.
Search Engine Advertising (PPC)
Global spend on search engine advertising hit $189 billion in 2025, accounting for 21% of all advertising budgets.
Google Ads still dominates the space, holding 76% of global PPC market share, while Microsoft Ads trails with 14%.

The average cost per click (CPC) across all industries is $1.61, with legal keywords reaching as high as $7.94.
Branded keywords have a 2.3x higher conversion rate than non-branded keywords on average.
The click-through rate for the top search ad position is 6.4%, compared to 3.1% for the second position.
Mobile search ads generate 58% of total PPC clicks, while desktop accounts for 36%.
Businesses earn an average of $3.12 in revenue for every $1.00 spent on paid search.
Shopping ads now account for 42% of all e-commerce search ad spend.
Responsive Search Ads (RSAs) outperform Expanded Text Ads (ETAs) by 19% in average CTR.
B2B campaigns have an average PPC conversion rate of 3.2%, compared to 5.1% for B2C campaigns.
Industries with the highest average PPC ROI include insurance (8.7x) and software (6.2x).
Call-only ads drive 28% more qualified leads in local service industries compared to traditional search ads.
The average Quality Score for top-performing ads is 8.6, while underperforming ads average just 5.3.
Healthcare-related keywords have the highest average CPC, with some niches exceeding $15 per click.
Dynamic keyword insertion (DKI) improves ad relevance and boosts CTR by 22% on average.
Click fraud rates have dropped to 5.1% in 2025, down from 6.4% the year prior.

The average landing page conversion rate from PPC traffic is 4.6%, higher than organic search at 2.9%.
Display Advertising
Global display ad spend reached $112 billion in 2025, making up 13% of total advertising investment.
Banner ads account for 46% of all display impressions, while native display ads represent 39%.

The average click-through rate (CTR) for standard display ads is 0.71%, while native formats average 1.13%.
Programmatic buys represent 82% of all display ad transactions in 2025.
Retargeted display ads see a 3.4x higher conversion rate than first-touch display campaigns.
Static image ads still make up 58% of all display ad formats, though HTML5-based rich media is quickly growing.
Display ads on desktop screens average a 64% viewability rate, compared to 73% on mobile.

The average CPM for display ads is $4.26, with retail and finance industries paying the highest.
Publishers using contextual targeting in display ads report a 27% boost in engagement over interest-based targeting.
Top-performing display ads feature clear call-to-action buttons 67% of the time.
B2B marketers allocate 22% of their digital ad budget to display, compared to 31% for B2C brands.
Google Display Network serves 73% of all global display ad impressions.
Animated display ads yield a 42% higher engagement rate than static creatives in the same placements.
Ads placed above the fold see 56% more interactions than those placed below the fold.
Display ads with motion (scroll-based or parallax) retain attention for an average of 2.4 seconds longer.
Industries using dynamic creative optimization (DCO) in display campaigns report a 31% increase in conversions.
The most common ad size in 2025 remains the 300x250 rectangle, accounting for 23% of impressions served.
Programmatic Advertising
Programmatic ad spend reached $478 billion globally in 2025, making up 54% of total global ad investment.

Display and video make up 79% of all programmatic transactions, with audio and CTV growing steadily.
Open auctions account for 61% of all programmatic impressions, while private marketplaces (PMPs) account for 29%.
Programmatic video ads have a 34% higher viewability rate than programmatic display ads.
The average CPM for programmatic video is $16.80, compared to $5.20 for programmatic display.

Mobile inventory makes up 68% of all programmatic impressions in 2025.
Header bidding now powers 72% of programmatic ad placements on top-tier publisher sites.
Campaigns using first-party data in programmatic targeting see a 2.9x lift in ROI compared to those using third-party segments.
Programmatic guaranteed deals increased by 17% year-over-year, reflecting demand for brand-safe environments.
Contextually targeted programmatic ads outperform behavioral targeting by 22% in click-through rates.
Fraud detection tools block an estimated 14 billion invalid impressions per day across programmatic exchanges.
CTV (Connected TV) programmatic spend rose to $21.7 billion, up from $16.2 billion in 2024.
The average win rate on real-time bidding (RTB) platforms is 29%, varying by region and vertical.
Brands allocating more than 50% of their budget to programmatic channels report 33% faster campaign optimization times.
Programmatic ads served during daytime hours have a 17% higher engagement rate than those shown overnight.
Ad load times affect performance, with creatives loading in under 2 seconds delivering 39% more clicks.
Programmatic campaigns that combine native and display formats see a 24% boost in engagement versus using either format alone.
Influencer Marketing
Global influencer marketing spend reached $32.6 billion in 2025, up from $27.8 billion in 2024.

Instagram remains the top platform for influencer campaigns, capturing 41% of total influencer ad spend.
TikTok follows closely with 34%, especially popular among Gen Z-focused brands.
Micro-influencers (10K–100K followers) have an average engagement rate of 4.3%, compared to 1.8% for mega influencers.
Sponsored TikTok videos average 3.7x more shares than sponsored Instagram posts.
Beauty and skincare brands account for 26% of all influencer campaign budgets globally.
Influencer content with product demos converts 48% better than lifestyle-focused content.
YouTube influencers generate the highest average watch time per sponsored video at 7.2 minutes, compared to 4.9 minutes on Instagram Reels.

B2C companies dedicate 17% of their digital budget to influencer marketing, while B2B companies allocate 6%.
Influencer stories on Instagram have a tap-forward rate of 37%, with a completion rate of 63%.
Campaigns with influencer whitelisting (brand-boosted influencer posts) perform 42% better in reach than non-whitelisted content.
TikTok influencers under age 25 drive 61% of total platform engagement in sponsored content.
Campaigns featuring unboxing videos outperform generic promotional posts by 29% in CTR.
Food and beverage collaborations with influencers rose 19% in 2025, with recipe-style content showing the best retention.
The average cost per post from a macro influencer (100K–1M followers) is now $2,790, up 11% from last year.
Influencer-led product launches generate 38% more traffic in the first 72 hours than traditional ad-based launches.
Brands that re-use influencer content in paid ads see 2.2x higher ROI compared to brands that don’t.
Traditional Advertising (TV, Radio, Print)
Traditional advertising spend reached $192 billion in 2025, representing 22% of global ad investment.

Television remains the largest traditional channel, accounting for 68% of traditional media spend.
Print advertising now makes up 14% of traditional spend, down from 17% in 2024.
Radio advertising holds 18% of the traditional ad market, with steady performance in local and regional campaigns.
TV ad viewership is highest during prime time, where 62% of viewers watch ads in full compared to 39% outside peak hours.

Magazine ads have an average engagement time of 9.2 seconds, slightly higher than newspaper ads at 7.4 seconds.
Brands running both print and digital campaigns together see a 31% increase in overall message recall.
National radio campaigns deliver 22% more reach than local-only radio buys.
Print ads with full-page placement achieve 47% better brand recall than half-page formats.
Direct response TV (DRTV) ads generate a 3.2% conversion rate, compared to 1.6% for non-response TV spots.
Political advertising made up 11% of all TV ad spend in 2025, driven by global elections.
Multi-platform campaigns that include TV and digital outperform single-channel campaigns by 2.7x in ROI.
FM radio spots cost an average of $18.60 per thousand listeners (CPM), slightly less than AM at $21.40.
Sunday newspapers still offer the highest ad visibility in print, accounting for 42% of total print ad readership.
TV commercials featuring subtitles retain 28% more viewer attention than those without.
In-store traffic lifts by 12% on average within 48 hours of airing a regional radio ad.
Ads placed on the back cover of magazines have a 19% higher interaction rate than inside-front placements.
Advertising ROI and Performance
The average ROI across all advertising channels in 2025 is $3.42 earned for every $1.00 spent.
Video ads deliver the highest ROI among digital formats, with an average return of $4.10 per dollar spent.
Email campaigns paired with paid ads increase ROI by 37% compared to using paid ads alone.
Social media ads deliver an average ROI of $2.87, slightly ahead of display ads at $2.29.
B2C brands report an average advertising ROI of 4.8x, compared to 3.2x for B2B brands.

The retail industry leads in ad performance, with an average ROI of 5.3x, followed by tech at 4.6x.
Campaigns using A/B testing improve ad performance by an average of 28%.
Ads with emotional storytelling see a 35% higher lift in purchase intent than product-focused ads.
Businesses that track campaign performance weekly report 21% higher ROI than those reviewing monthly.
Paid search ads generate 2.9x more return than organic SEO efforts in the first 30 days of launch.
Display ads optimized for mobile convert 44% better than desktop-first creatives.
Ads with a single CTA outperform those with multiple CTAs by 19% in conversions.
High-frequency ad exposure (5+ impressions per user) leads to a 22% drop in ROI for most campaigns.
Interactive ads (quizzes, polls, sliders) generate a 41% higher engagement rate than passive formats.
Campaigns running for 3–6 weeks average the best performance, outperforming shorter or longer campaigns by 16%.
Retargeting campaigns increase ad ROI by 2.3x compared to prospecting-only efforts.
Omnichannel campaigns report 3.5x stronger brand lift than single-channel campaigns.
Consumer Behavior and Ad Response
83% of consumers say they’ve purchased after seeing a digital ad in the past 30 days.
Video ads are considered the most persuasive format by 47% of consumers, followed by social media carousel ads at 22%.

Consumers aged 18–24 are 2.3x more likely to engage with ads that include interactive elements compared to those aged 45 and up.
Personalized ads increase purchase likelihood by 31%, compared to non-targeted ads.
62% of shoppers are more likely to trust ads featuring real user reviews or testimonials.
Mobile users scroll past static ads 38% faster than motion-based ads.
Ads that appear within the first three scrolls of a page are 46% more likely to be clicked.
54% of consumers say they ignore ads that don’t reflect their interests or recent activity
Gen Z users are 2.1x more likely than millennials to report “skipping” or swiping past ads within 2 seconds.
Consumers respond 29% better to ads with localized content (city or region names) than to generic nationwide messaging.
71% of consumers say repetition of the same ad more than five times reduces their likelihood to convert.
Users shown ads with humor are 33% more likely to recall the brand compared to ads with a purely informational tone.

48% of users expect to see the product’s price in the ad itself before clicking.
Split-screen video ads (showing product + person using it) outperform single-focus videos by 24% in engagement.
36% of consumers say they’re more comfortable clicking ads on YouTube than on Instagram.
Shoppable ads with embedded product links generate 2.6x higher intent-to-purchase than non-clickable formats.
Emotional tone impacts behavior: uplifting ads see a 41% higher share rate than neutral-tone ads.
Ad Blocker Usage
42% of global internet users use some form of ad blocker in 2025.
Desktop devices have the highest ad blocker adoption, with 51% of users running a blocker, compared to 36% on mobile.

Users aged 18–34 make up 61% of all ad blocker users globally.
The most common reason for using ad blockers is intrusive ads, cited by 67% of users.
Websites that display unskippable video ads are 2.4x more likely to trigger ad blocker installations.
Ad blocker usage is highest in Europe at 49%, compared to 39% in North America and 35% in Asia.
Tech-savvy users are 3.1x more likely to install ad blockers than casual browsers.
Mobile browsers with built-in ad-blocking features are used by 28% of mobile users globally.
47% of ad blocker users say they would disable their blocker for sites that offer fewer, better-designed ads.
Publisher revenue loss from ad blockers is estimated at $29 billion globally in 2025.
Native ads bypass ad blockers 61% of the time, while traditional banner ads are blocked in 94% of cases.

54% of users with ad blockers still see branded content through influencer promotions and social video.
Gamers are more likely to use ad blockers, with 68% of PC gamers actively blocking ads.
22% of users with ad blockers whitelist specific websites they trust or regularly support.
Mobile ad blocker usage rose by 5.6% year-over-year, driven by privacy-focused browsers and apps.
Users who block ads also skip pre-roll videos 39% more frequently than those who don’t use blockers.
Sites with lightweight ad experiences see a 31% lower bounce rate among users with previously active ad blockers.
Industry-Specific Advertising Stats
Retail leads global ad spending by industry, investing over $97 billion in 2025.
The tech sector follows with $81 billion, focused heavily on digital and video formats.
Automotive brands allocate 41% of their ad budget to TV, more than any other industry.
Fashion advertisers spend 64% of their total budget on social media, compared to 38% for electronics brands.
Healthcare companies increased digital ad spend by 19%, focusing on mobile-first formats.
Food and beverage brands invest 27% of their budget in influencer marketing, the highest among all industries.
Financial services report the highest ROI from search ads at 6.1x, while travel sits at 4.2x.

Education-based advertisers use video in 72% of campaigns, far more than retail at 51%.
Entertainment brands see a 33% higher engagement rate on short-form video ads compared to other industries.
B2B SaaS companies dedicate 44% of their budget to content-driven ads, such as webinars and whitepaper promotions.
CPG (consumer packaged goods) brands rely on out-of-home ads for 18% of their total media mix.
Real estate advertisers report a 47% lead conversion rate from Facebook Lead Ads, higher than any other format they use.
Gaming companies spend 53% of their ad budget on mobile platforms, compared to 29% for traditional desktop channels.
Travel brands using dynamic creative optimization report a 2.8x lift in click-through rates.
Beauty brands see 38% higher conversion rates from TikTok ads compared to Instagram in 2025.
Telecom brands allocate 34% of their ad spend to retargeting campaigns, outperforming other industries by 11%.
Home improvement advertisers report that local geo-targeted ads deliver 2.5x better in-store foot traffic than national ads.
Future Trends in Advertising
AI-powered tools are already involved in 61% of campaign asset creation, including ad copy and visuals.
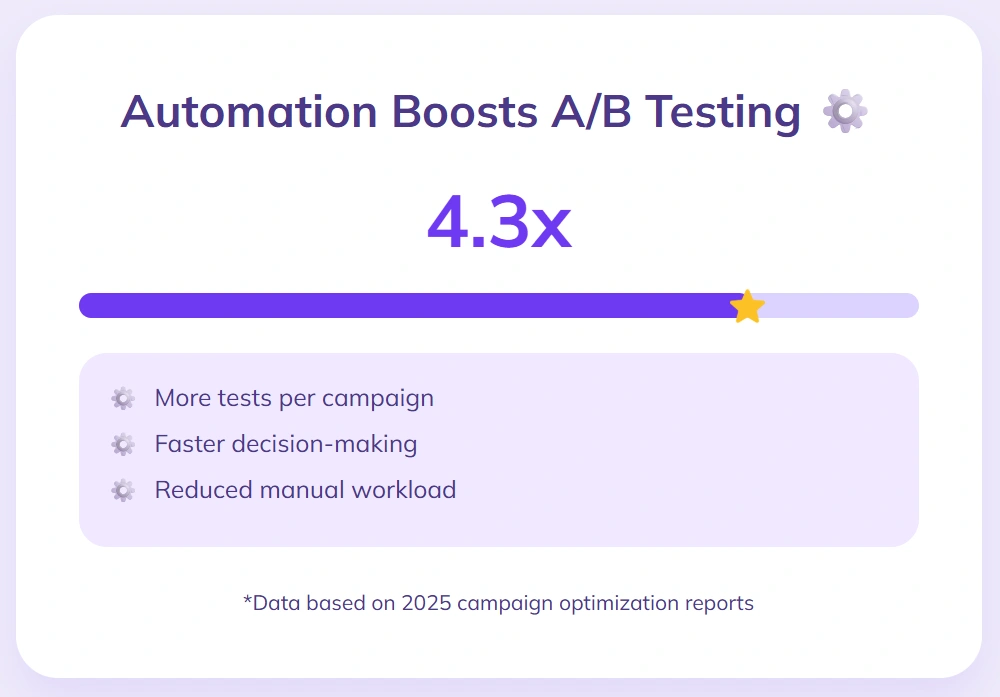
Brands using automation for A/B testing complete 4.3x more experiments per campaign than manual-only teams.
Shoppable ads now appear in 37% of social campaigns, especially on platforms like TikTok and Pinterest.
Voice search advertising has been adopted by 19% of enterprise brands, mostly in retail and food delivery.
Advertisers using dynamic product feeds in video ads report 2.6x higher click-through rates than static video formats.
Augmented reality (AR) ads are now used by 28% of fashion and beauty brands, more than double the 2023 levels.
Programmatic audio ad spend reached $5.9 billion in 2025, led by music streaming and podcast platforms.
Brands incorporating AI chatbots in post-ad interactions see 33% higher lead qualification rates.
Contextual targeting has overtaken behavioral targeting in 52% of ad strategies following tighter data privacy norms.
Interactive video ads are included in 29% of e-commerce campaigns, up from 21% last year.
QR code ads appear in 17% of OOH placements, with retail brands leading usage.
CTV ad budgets now make up 14% of digital video spend, growing faster than traditional pre-roll formats.
Brands using sentiment analysis tools optimize ad tone 2.1x faster during real-time campaigns.
Gamified ad formats are now standard in 23% of mobile ad campaigns, especially among Gen Z-targeted brands.
Multi-language ad sets are used in 41% of global campaigns, compared to 28% just two years ago.
Social commerce integration features (like in-app checkout) are active in 49% of retail ad campaigns.
Sustainability-themed messaging appears in 38% of major brand campaigns across fashion, travel, and food sectors.
Conclusion
Looking through these 250+ stats, one thing becomes clear: good advertising isn’t about following trends, it’s about paying attention. Behind every successful campaign is a set of choices backed by insight, not guesswork.
These numbers show what’s connecting with audiences, what’s getting results, and where smart marketers are focusing their efforts in 2025.
That doesn’t mean there’s a perfect formula. There never is. But with data like this, you’re not starting from scratch.
You’re working with a clearer sense of direction. Use these insights to adjust your strategy, test new ideas, or simply confirm what you’ve already suspected about what’s working and what isn’t.
Advertising will keep evolving, and so will the platforms we use. But some things stay consistent: timing matters, relevance wins, and data beats gut instinct. Keep this list close.
It’s a reliable check-in point whenever you need a reminder of where the real traction is happening.

A seasoned entrepreneur and AI enthusiast, Michael frequently shares insights on the intersection of technology and marketing. His writing focuses on leveraging artificial intelligence to enhance marketing strategies.
Create videos 10x faster and easier with Zebracat
Try it now


Comments