
Table Of Content

Visual content is everywhere these days, and it’s no surprise that it plays a huge part in how people connect with brands.
Whether it’s on social media, websites, or ads, images and videos tend to grab attention much faster than plain text.
For marketers, knowing how important visuals are can make a big difference in creating campaigns that click with their audience. This list of over 80 statistics gives a clear picture of just how much visuals matter.
From what people respond to, to the latest trends on different platforms, these numbers offer some useful insights to help marketers create content that really works.

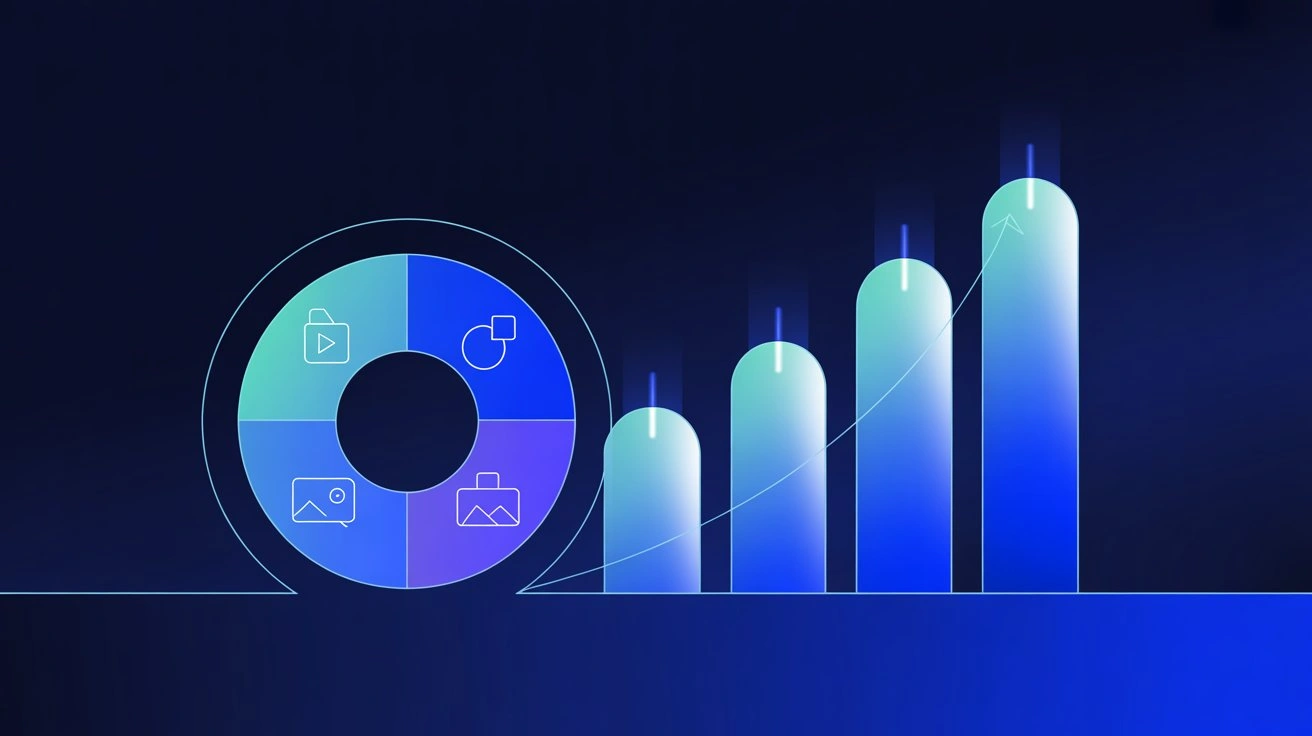
Visual Content Usage Trends
85% of marketers in 2025 say visual content is a core part of their marketing strategy, up from 72% in 2019.
Over 70% of all brand content shared online in 2025 included images or videos.
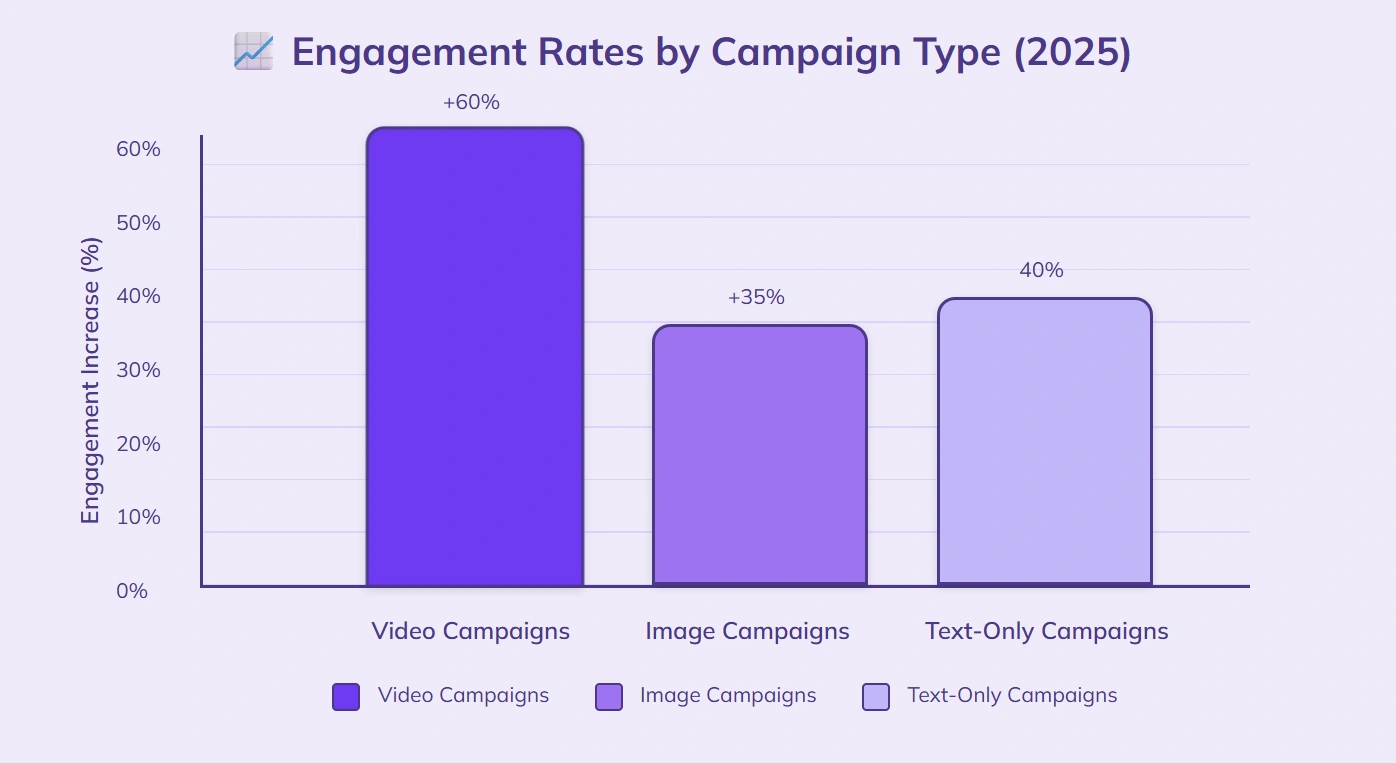
Video campaigns in 2025 generated 60% higher engagement rates than text-only campaigns, with 40%, while image-based campaigns saw a 35% increase.
Instagram posts with images received 38% more interactions in 2025 than posts without images.
In 2023, 75% of businesses reported increasing their use of infographics, up from 55% in 2018.
Mobile users watched 50% more video content on average in 2025 compared to desktop users, who increased video consumption by 20% over the same period.
Brands posting visual content weekly saw a 400% (4 times) increase in website traffic in 2025, compared to those posting visuals monthly, who averaged a 120% increase.
Visual content made up 80% of social media shares in 2025, a jump from 65% in 2020.
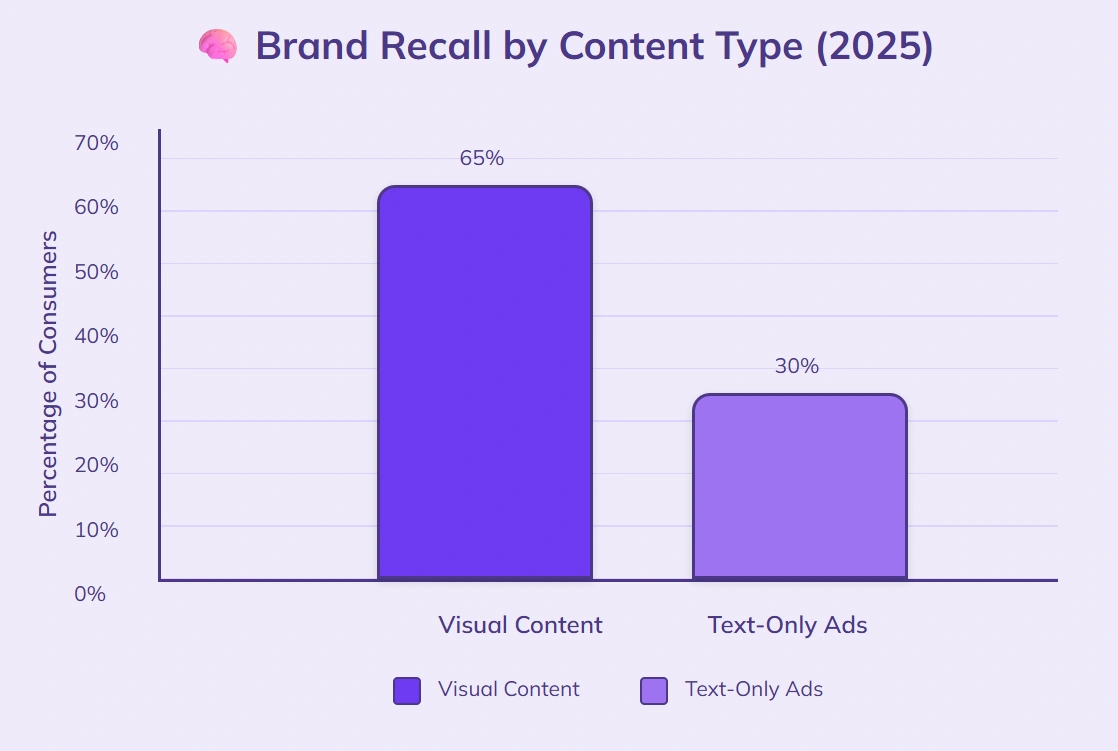
65% of consumers in 2025 said they remembered a brand better after seeing visual content, while only 30% said the same after reading text-only ads.
Social media video posts in 2025 received 48% more views than image-only posts.
The average viewer attention span for visual content dropped to 8 seconds in 2025 from 12 seconds in 2018, making early engagement more critical than ever.
AI in Visual Marketing
Marketers report that using text-to-video tools cuts average production time by nearly 50% compared to traditional editing workflows.
Campaigns featuring AI avatars have seen engagement rates rise by 38% compared to standard stock video ads.
When AI voice cloning is added to branded videos, viewer retention improves by about 45% on average.
Around 34% of creative teams use AI scene generation to storyboard ad concepts before committing to full production.
Automated editing tools help 68% of social media managers publish daily videos without needing a full-time editor.
Adding AI-powered subtitles boosts international viewership by 27%, making content more accessible worldwide.
Companies using AI explainer video makers have seen landing page conversions rise by 30% or more.
By 2026, nearly two-thirds of marketers (65%) say they plan to rely on AI video generation as a core part of their content strategy.
Video Marketing Statistics
According to video marketing statistics, 85% of businesses have adopted video marketing in their strategies.
Videos on landing pages increase conversion rates by an average of 80%.
Social media video posts receive 48% more views than image posts and 70% more than text-only posts.
Mobile video consumption rises by 100% year over year, compared to desktop video growth of 30%.
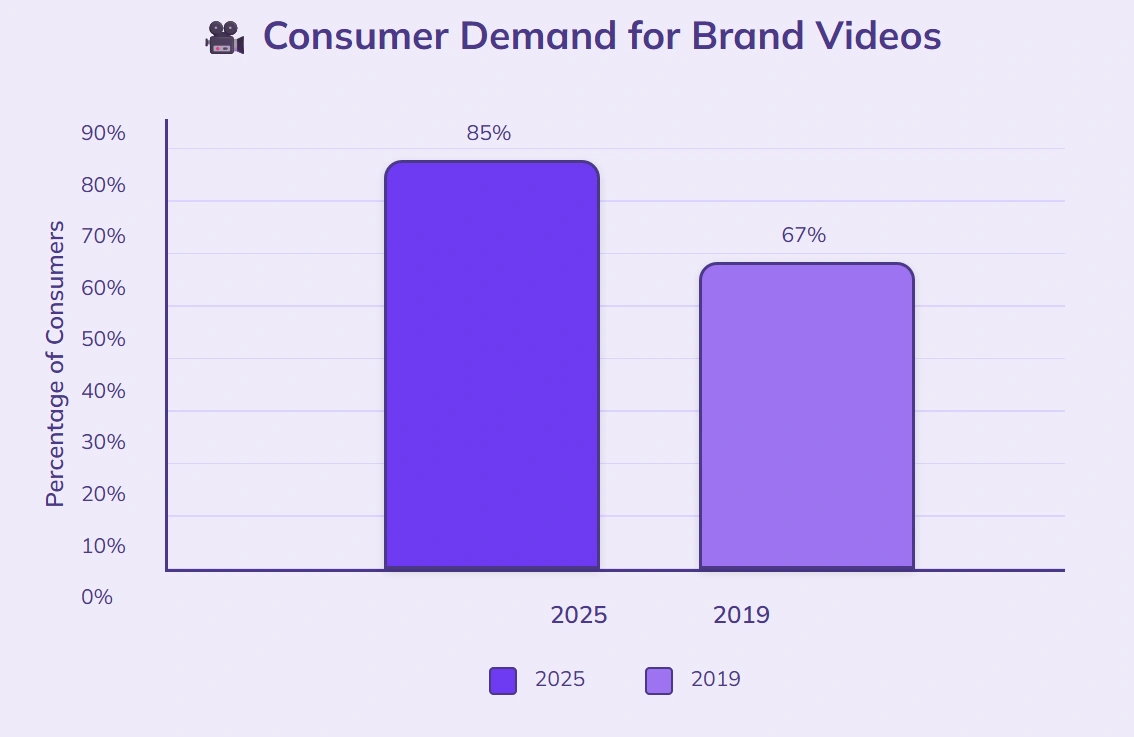
85% of consumers say they want to see more videos from brands in 2025, up from 67% in 2019.
According to statistics, emails with video thumbnails see a 34% higher click-through rate than those without.
Videos under 2 minutes receive the most engagement, with retention rates over 70%, while videos longer than 5 minutes drop below 40% retention.
Marketers who use video on social media generate 49% faster revenue growth than those who don’t.
78% of people watch videos at least once a week on social media platforms.
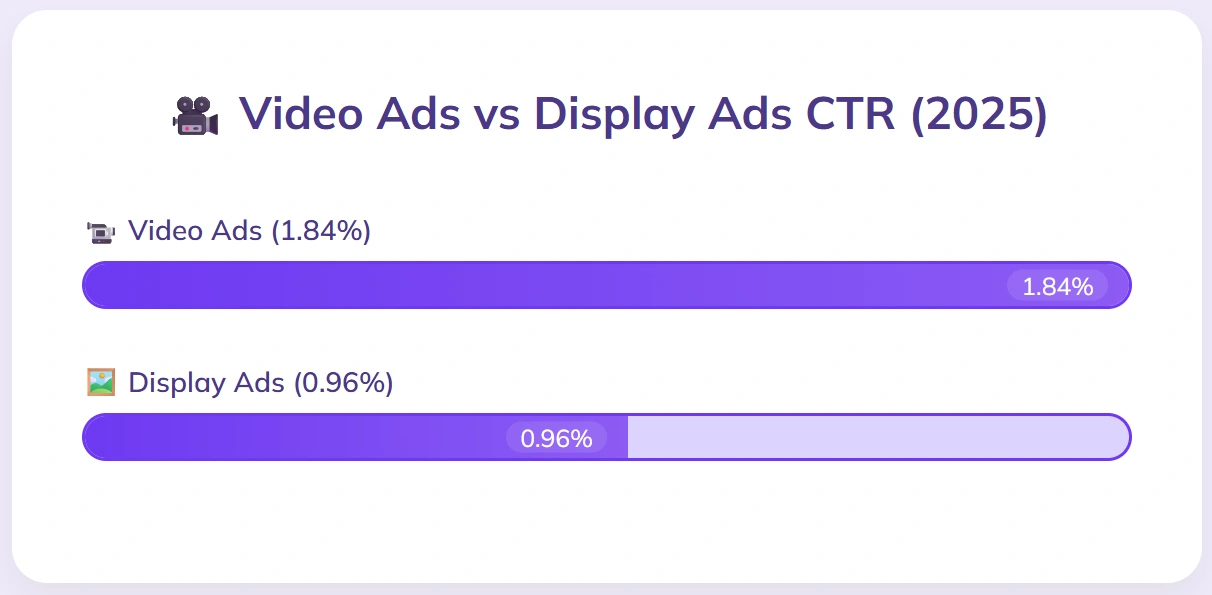
Video ads have an average click-through rate (CTR) of 1.84%, compared to 0.96% for display ads.
Videos generate 1200% more shares on social media than text and images combined.
Infographics and Data Visualization
In 2025, 72% of marketers say infographics are among the most effective visual content types for boosting audience understanding, up from 58% in 2019.
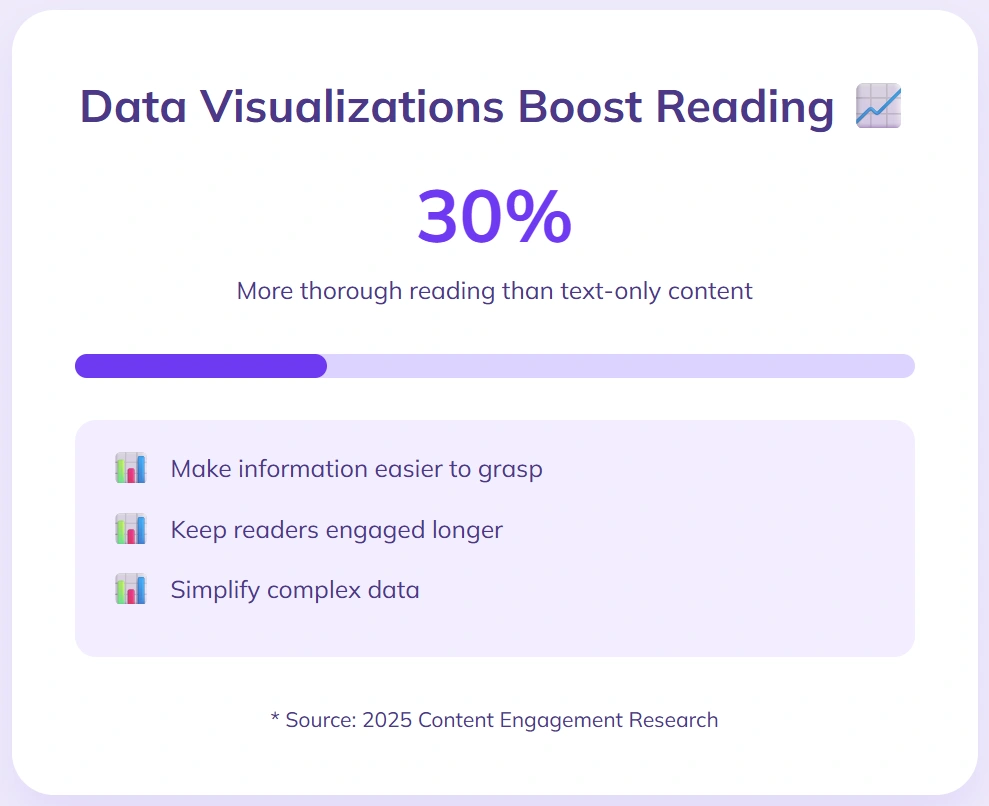
Content with data visualizations attracts 30% more thorough reading.
Infographics drive an average 37% increase in website traffic.
Social media posts featuring infographics receive 65% more shares.
Marketers using data visualization tools report a 25% rise in lead generation effectiveness.
Infographics hold audience attention for an average of 2.5 minutes, compared to 1.2 minutes for standard blog posts.
68% of consumers prefer to learn about products or services through visual content like infographics.
Visual data presentations enhance information retention by 42%.
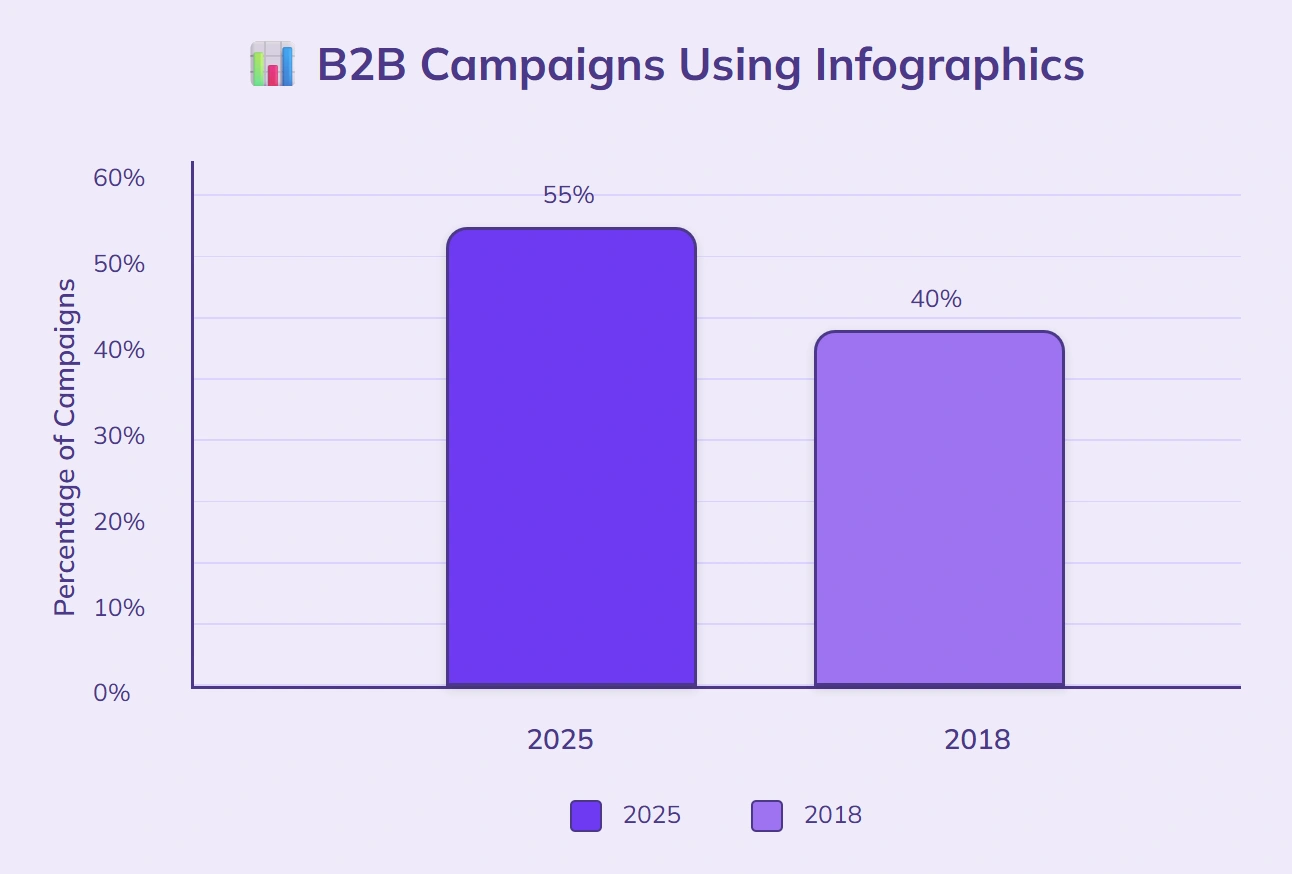
By 2025, 55% of B2B marketing campaigns incorporated infographics, a rise from 40% in 2018.
Emails containing infographics achieve a 28% higher open rate.
Data-driven infographics generate 50% more backlinks on average than written content.
Social Media Visual Content Stats
83% of social media marketers say visual content is the most important type of content for engagement in 2025, up from 68% in 2020.

72% of marketers report that using GIFs in social media posts increases audience interaction.
Visual content on social media is shared 300% more often, averaging 12 million shares per month, compared to 4 million for text-only content.
Stories with interactive visuals have an average completion rate of 75%.
65% of social media users say they are more likely to follow a brand that regularly posts engaging visuals.
Carousel posts on Instagram get saved 1.5 times more, with an average of 450,000 saves per post versus 300,000 saves for single-image posts.
Videos on Instagram have an average engagement rate of 7.2%.
Tweets with images receive an average of 150 retweets per post.
LinkedIn posts with visuals have an average of 200 shares.
Facebook posts with videos reach an average of 135,000 organic viewers.
55% of marketers increased their use of video content between 2019 and 2025, up from 30%.
Visual Content and Engagement
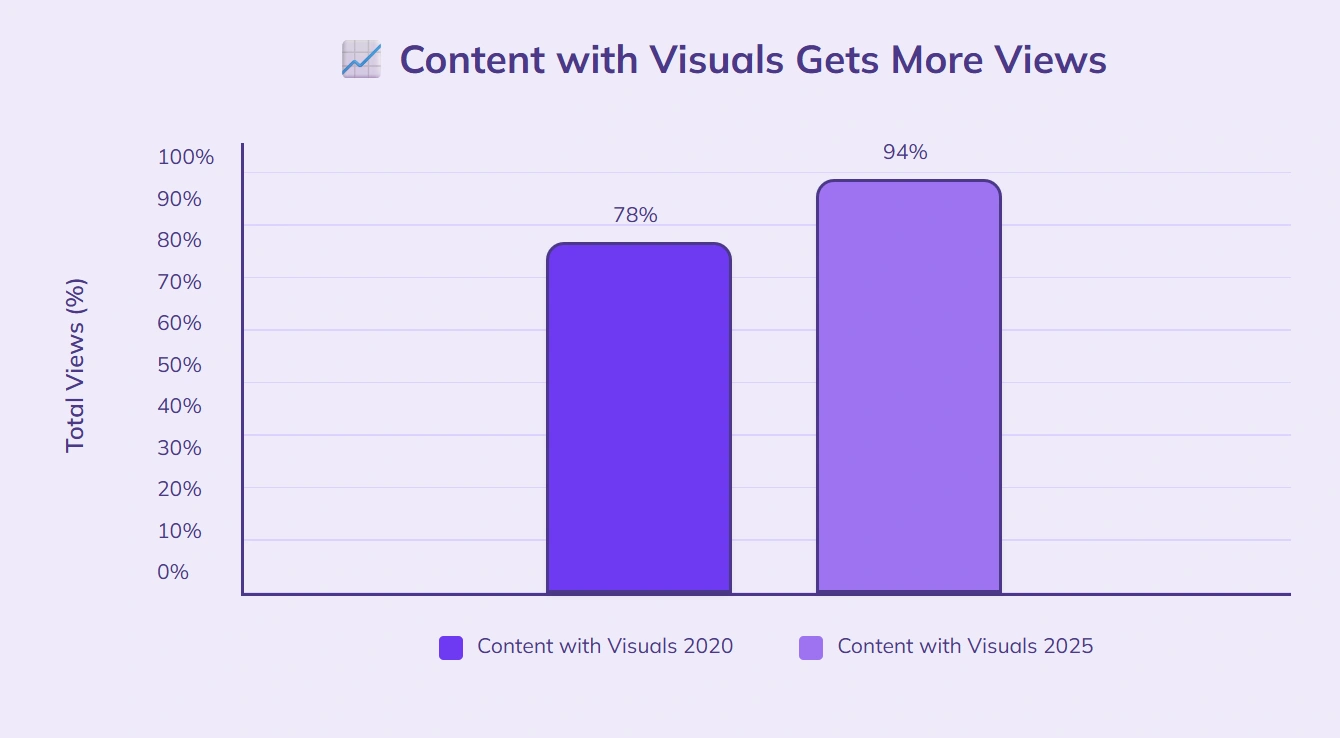
Content with visuals gets 94% more total views in 2025, up from 78% in 2020.
Posts with images on social media receive 40% higher engagement rates, averaging 1.2 million interactions per post.
Facebook posts with images have an average engagement rate 2.3 times higher, with 230,000 engagements per post compared to 100,000 for text-only posts in 2025.
Videos on social platforms generate 1.2 million shares per month.
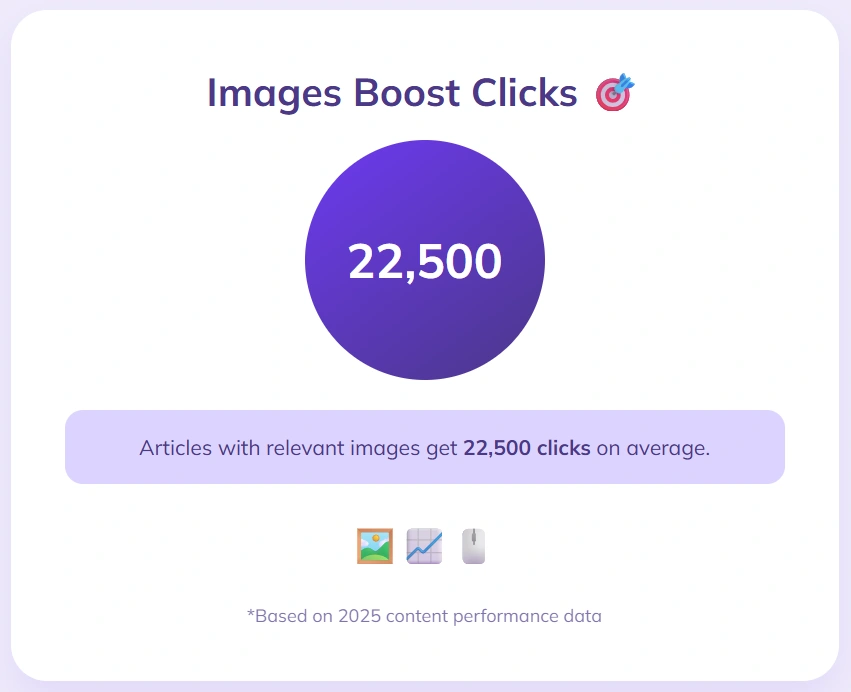
Articles with relevant images get 22,500 clicks on average.
Infographics receive about 8,700 interactions per post.
Visual content in emails results in a 5.3% click-through rate on average.
Tweets with images receive approximately 150 retweets per post.
Posts with videos average 900,000 interactions each.
User-generated visual content posts average 1.35 million engagements per post.
Visual content posts on Instagram get an average of 720,000 likes.
Visual Content ROI and Conversion Rates
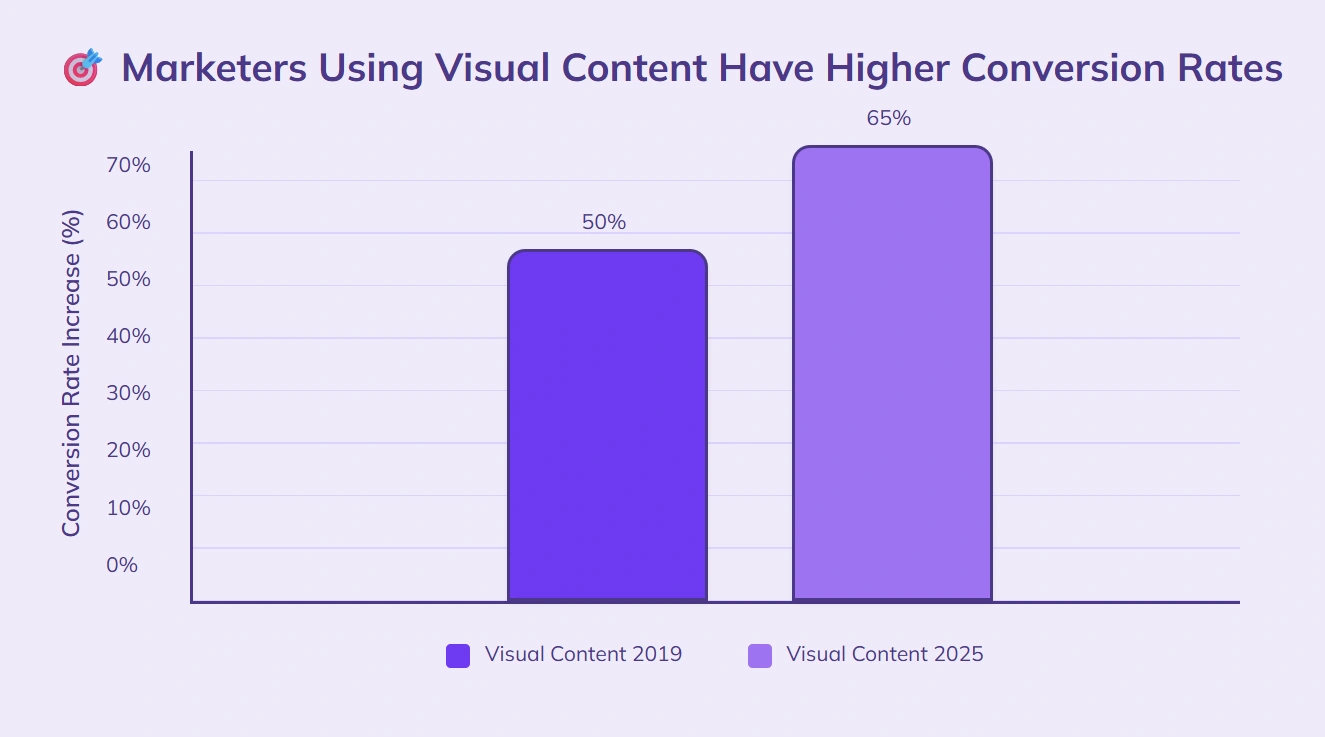
Marketers who use visual content report a 65% higher conversion rate compared to those who rely on text-only content in 2025, up from 50% in 2019.
Videos on product pages increase conversions by an average of 80%.
Email campaigns with visuals see a 34% higher click-through rate than those without images or videos.
Landing pages with infographics experience a 48% increase in form submissions compared to pages without visual elements.
Visual content drives 40% more ROI on average than campaigns without visuals.
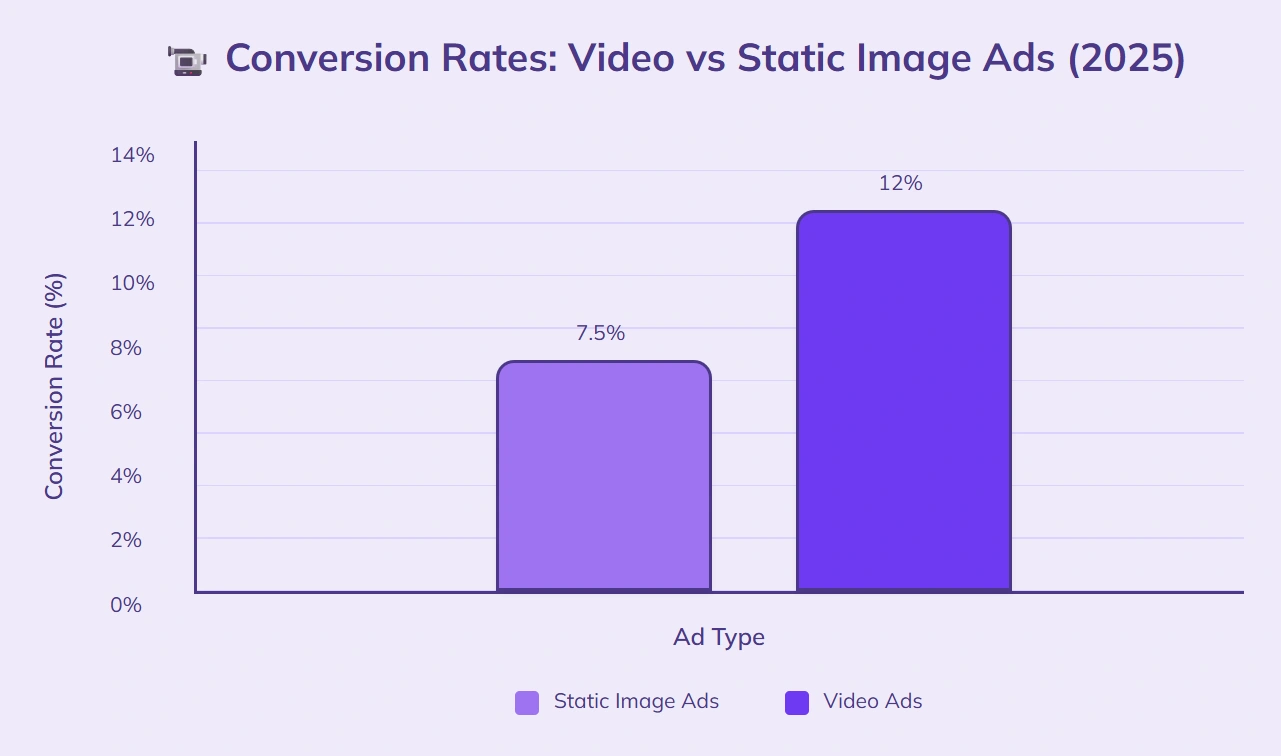
Social media ads with video content have a 12% conversion rate in 2025, which is 60% higher than the 7.5% conversion rate of static image ads.
Marketers investing in data visualization tools report a 25% increase in qualified leads over those who don’t.
Website visitors spend 70% more time on pages that include video or interactive visuals.
Brands using customer-generated visual content see a 35% boost in conversions compared to brands that don’t.
Product videos increase purchase intent by 85% among online shoppers.
Visual call-to-action buttons convert at a rate 30% higher than text-only buttons.
Future of Visual Content and AI Integration
In 2025, 68% of marketers say they currently use AI-powered tools to create or enhance visual content, up from 40% in 2021.
Marketers report a 25% reduction in content production time when using AI tools for visual content creation.
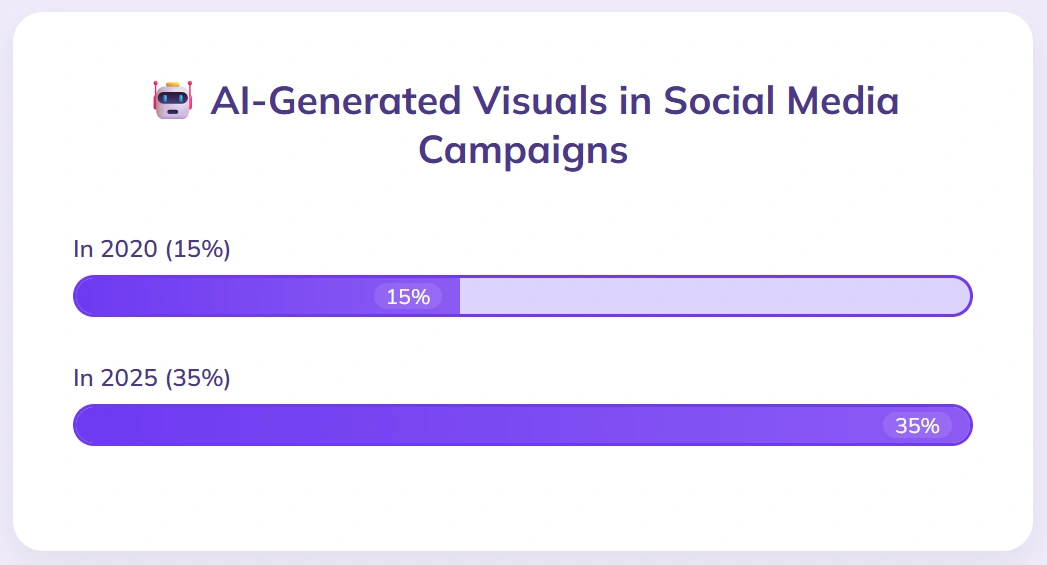
AI-generated visuals are used in 35% of social media campaigns in 2025, up from 15% in 2020.
Brands using AI for video editing experience a 20% higher viewer retention rate.
In 2023, 55% of businesses integrated AI to optimize image SEO, rising from 20% in 2019.
AI-powered personalization of visual content leads to a 35% increase in click-through rates on digital ads.
Automated design tools powered by AI cut the cost of visual content creation by an average of 28%.

AI-generated infographics improve comprehension rates by 22%.
Interactive visuals created with AI tools see a 40% higher engagement rate.
48% of marketers say AI integration has improved their ability to produce customized visual content at scale.
AI-enhanced images increase audience engagement by 30%.
The Bottom Line
The stats tell the story. Visual content isn’t just a nice-to-have; it’s a must-have in marketing today.
They show what draws people in, keeps them interested, and encourages them to take action. Using images and videos in the right way can make a real difference in reaching your audience.
Whether you’re posting on social media or designing a website, the right visuals go a long way. This collection of insights gives you a solid starting point to improve your marketing and connect with people in a way that feels real.

A seasoned entrepreneur and AI enthusiast, Michael frequently shares insights on the intersection of technology and marketing. His writing focuses on leveraging artificial intelligence to enhance marketing strategies.
Create videos 10x faster and easier with Zebracat
Try it now


Comments